Caro Real Estate
19 active listings · 50 sold in the past 12mo
$210,000
Median List Price
50
Sold (past 12mo)
71
Avg Days on Market
+8.6%
HFGⓘ
Household Formation Gap (HFG) is a secondary market indicator that measures hidden housing demand created by shrinking household sizes. As average household size decreases — due to divorce, single living, empty nesting, delayed marriage — more housing units are needed even without population growth. HFG compares the estimated number of households needed today versus 15 years ago: (population ÷ avg household size). This is a demographic trend signal, not a primary market indicator like income-based affordability or comparative market analysis. Source: U.S. Census Bureau, American Community Survey 5-Year Estimates (2009–2023), Tables B01003, B25010, B25001.
Active Listings
Loading map…
Market Dashboard
Homes for Sale(19)
View all with filters →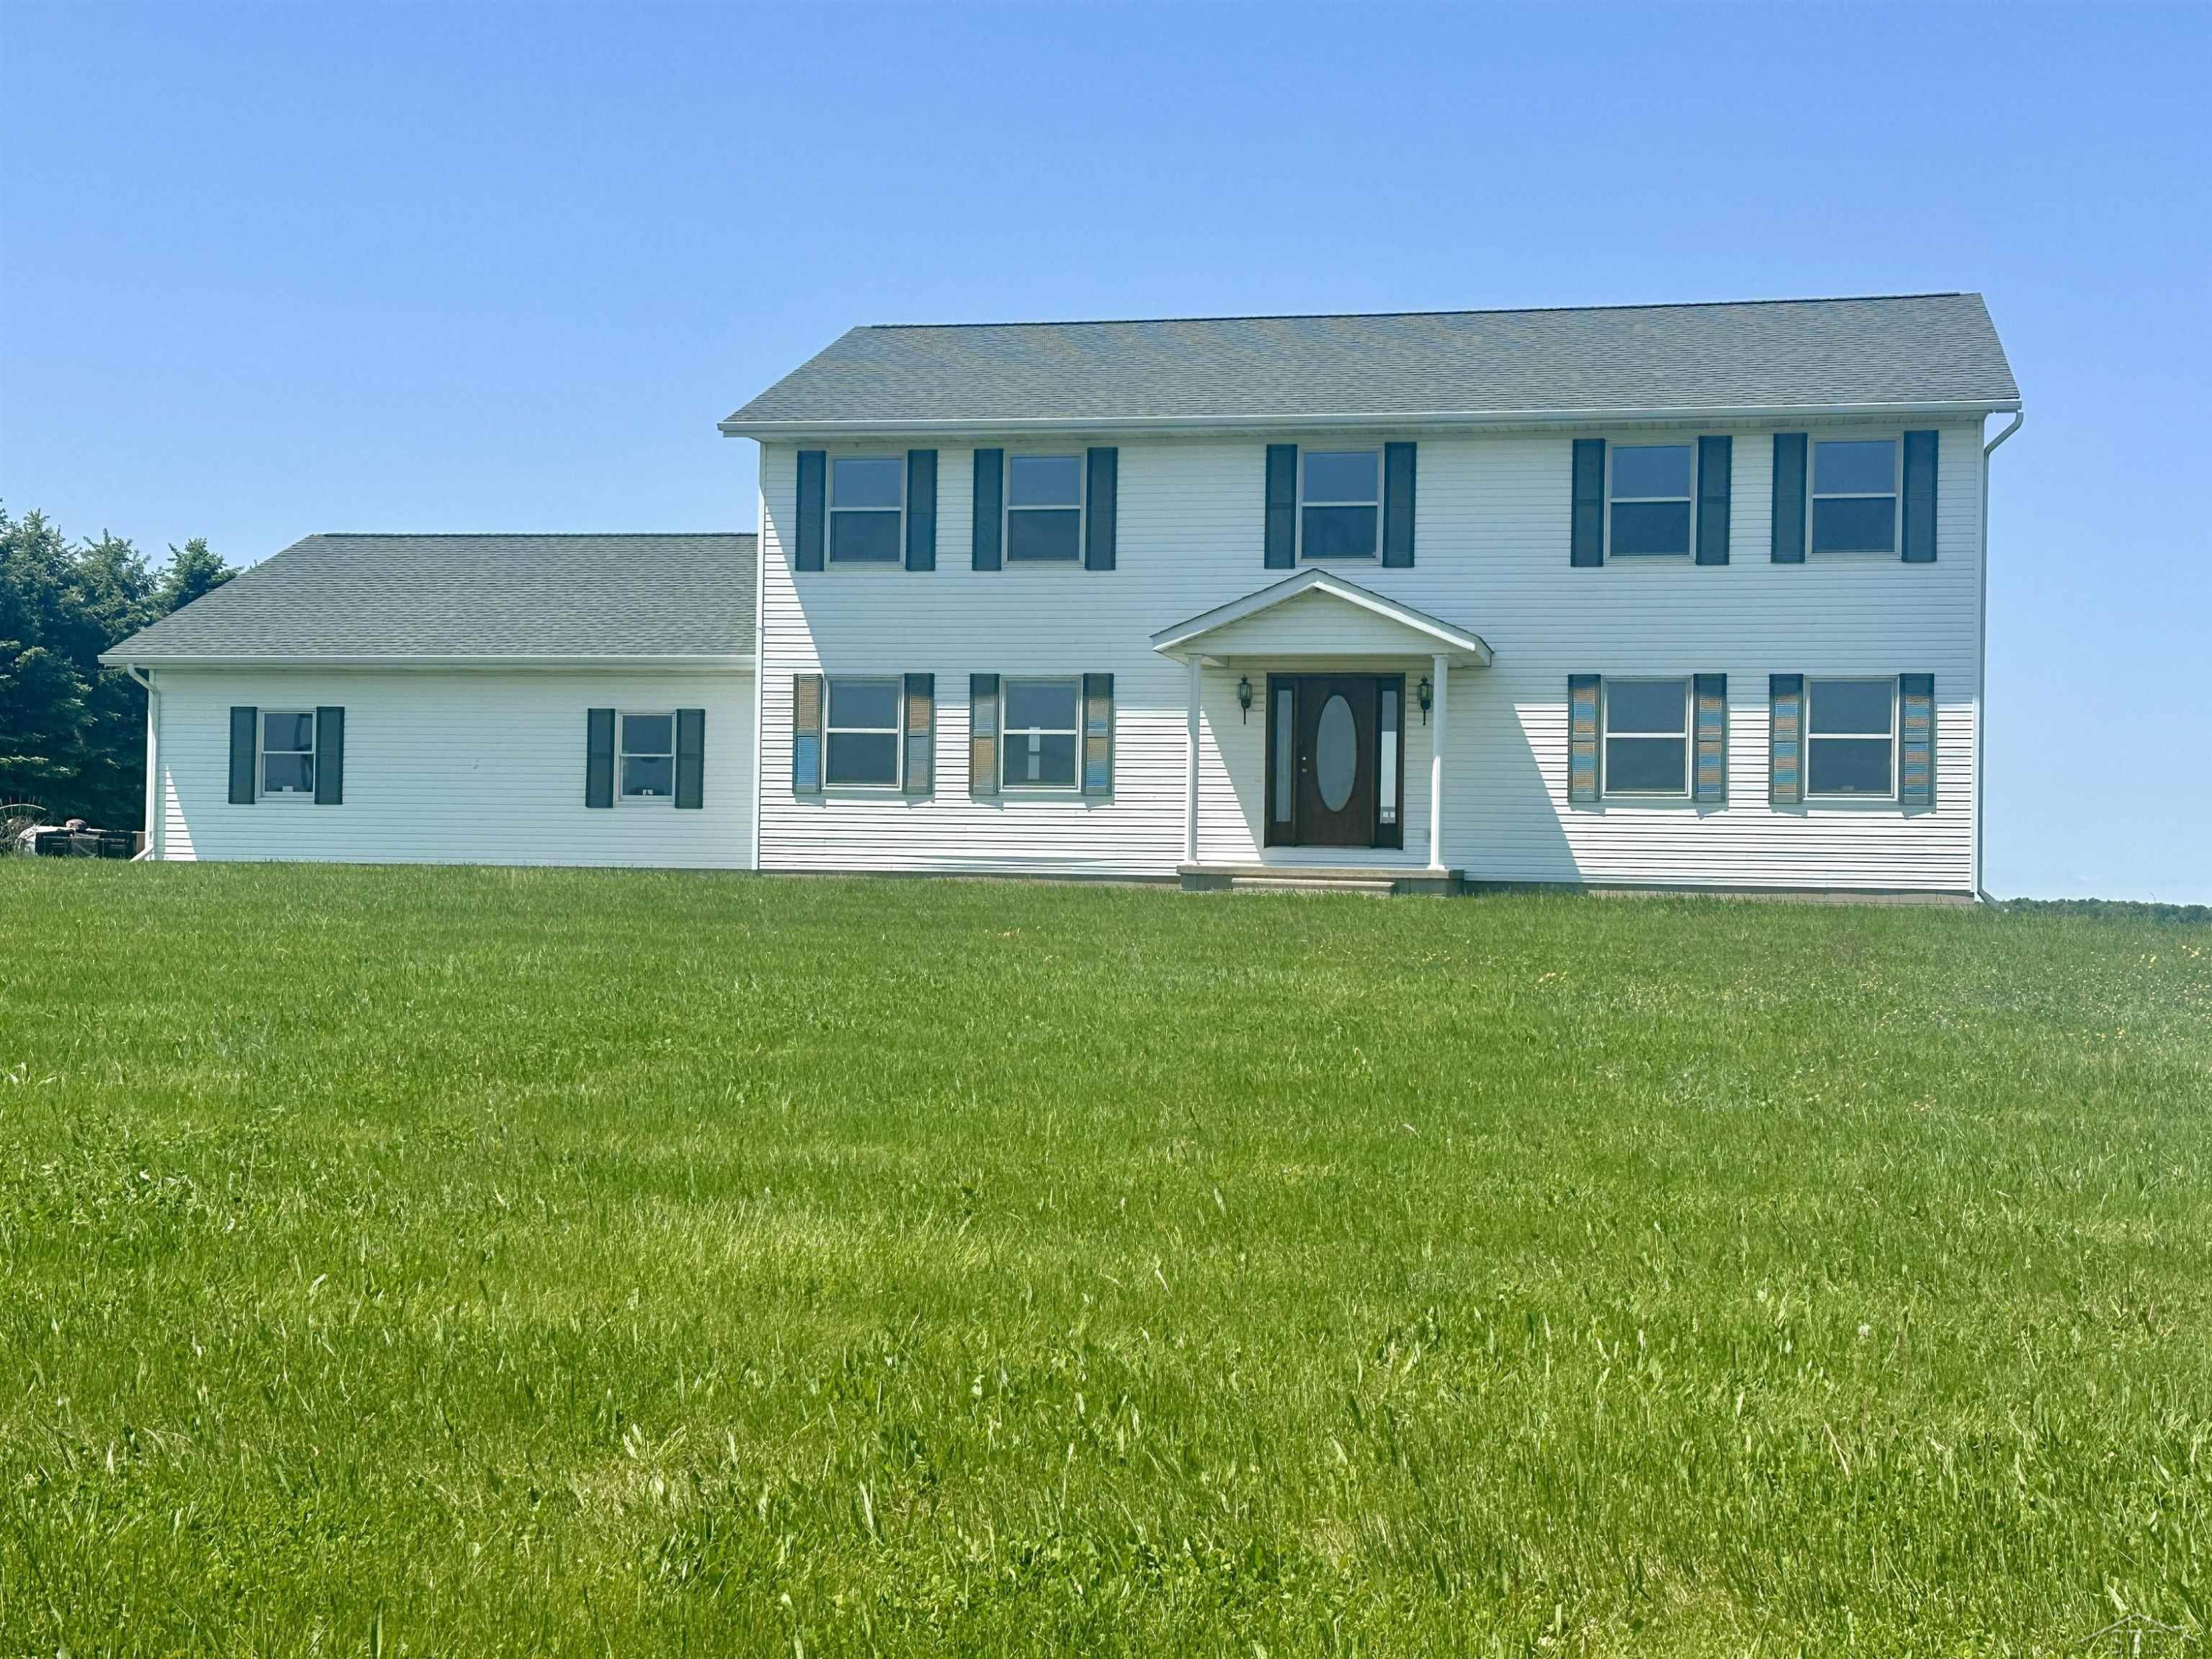
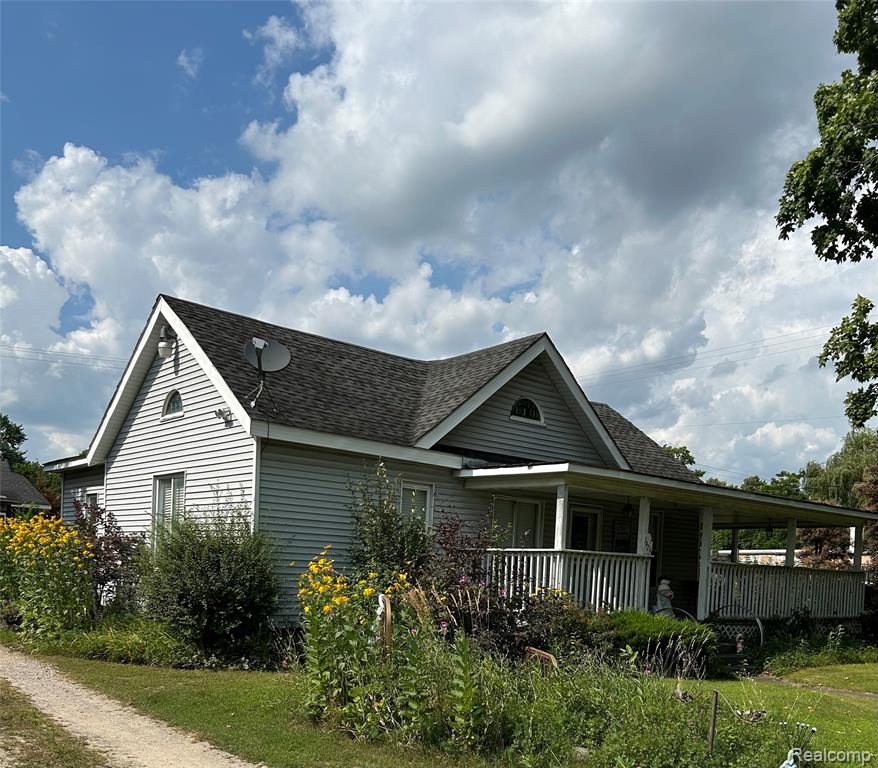
For Sale
1/47
$599,900
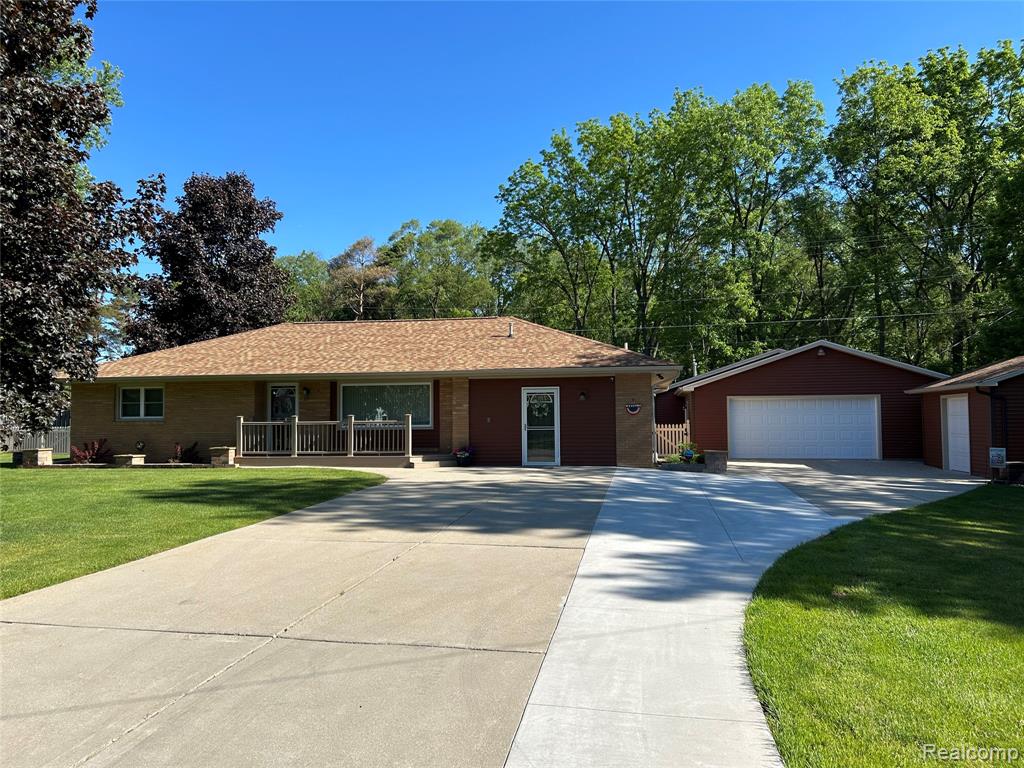
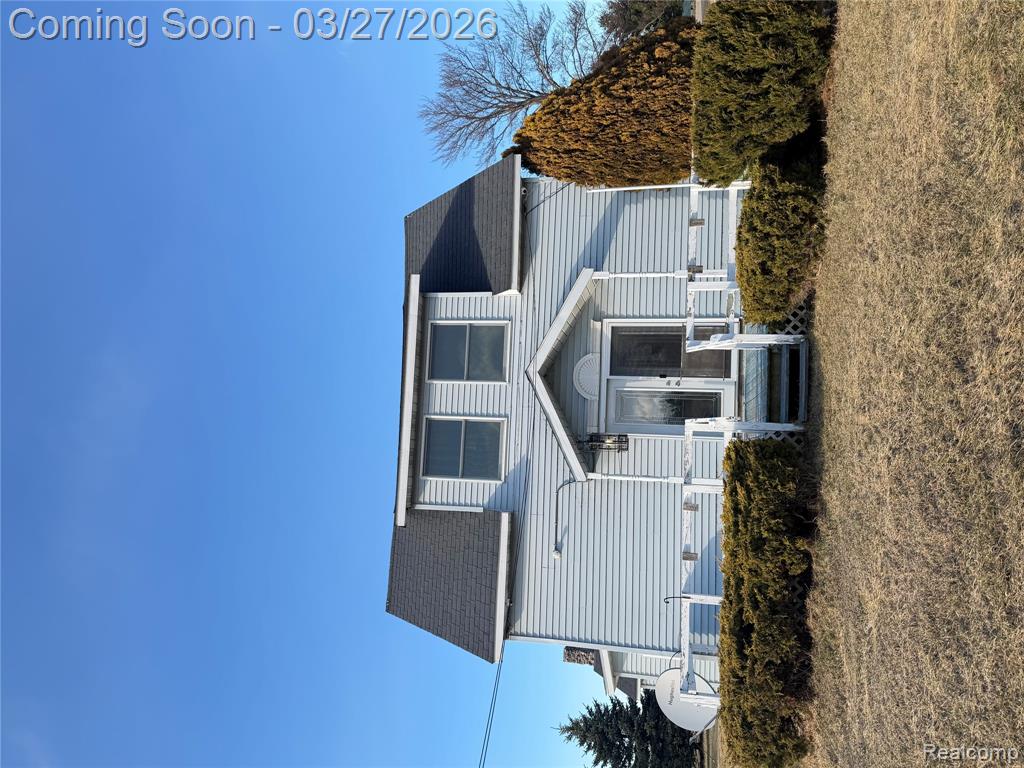
2649 Colwood Road, Caro, MI 48723
4 bd2 ba18.62 ac
Single Family

For Sale
1/36
$425,000
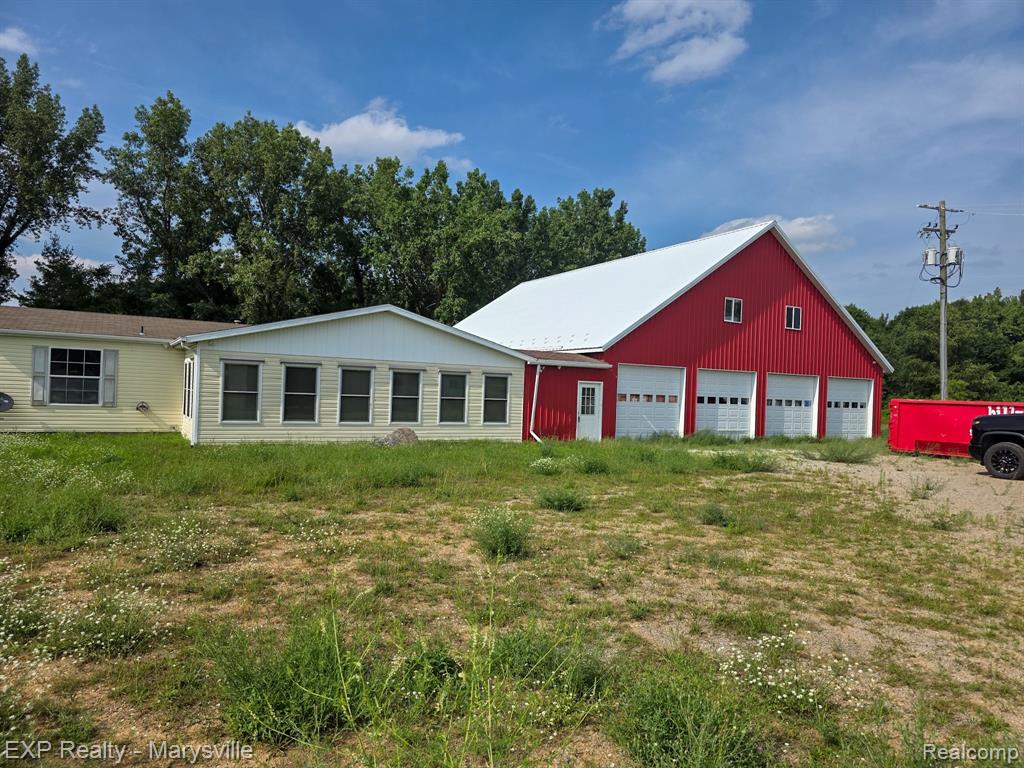
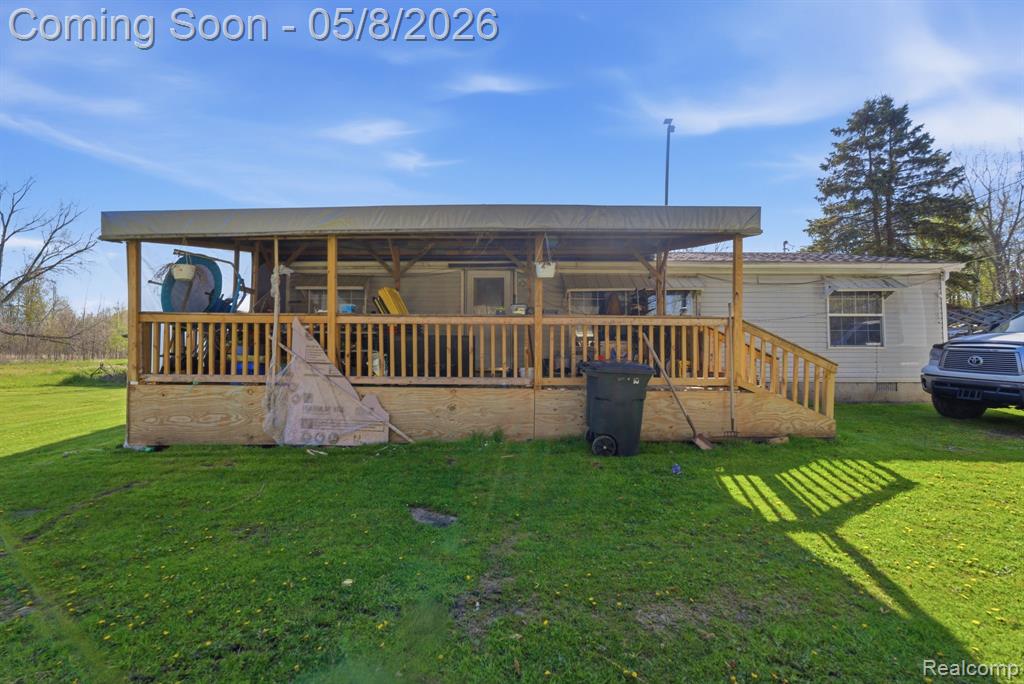
2404 Froede Road, Caro, MI 48723
5 bd2 ba2,320 sqft5.38 ac
Single Family
For Sale
1/27
$345,000
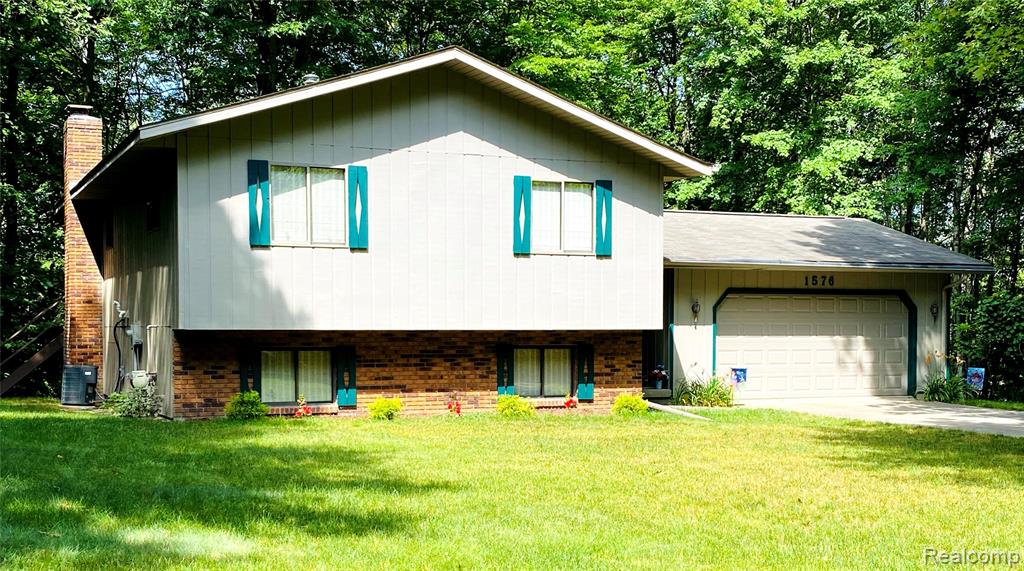
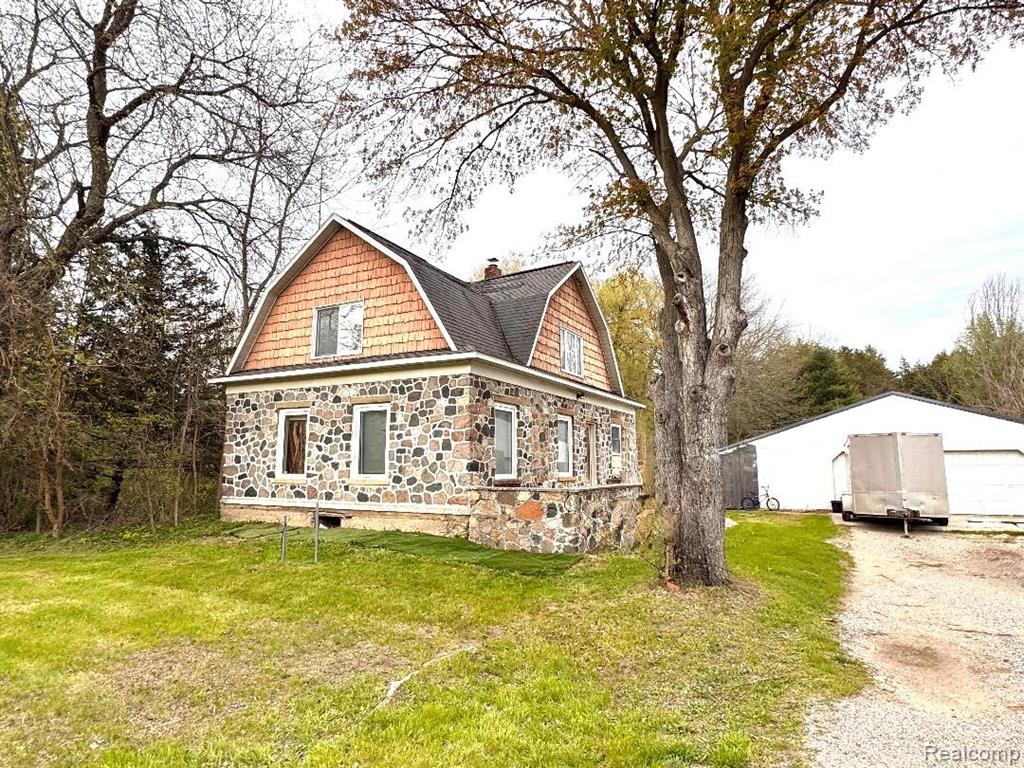
1576 Pine Knoll Lane, Caro, MI 48723
3 bd2 ba2,316 sqft1.61 ac
Single Family
For Sale
1/64
$305,900
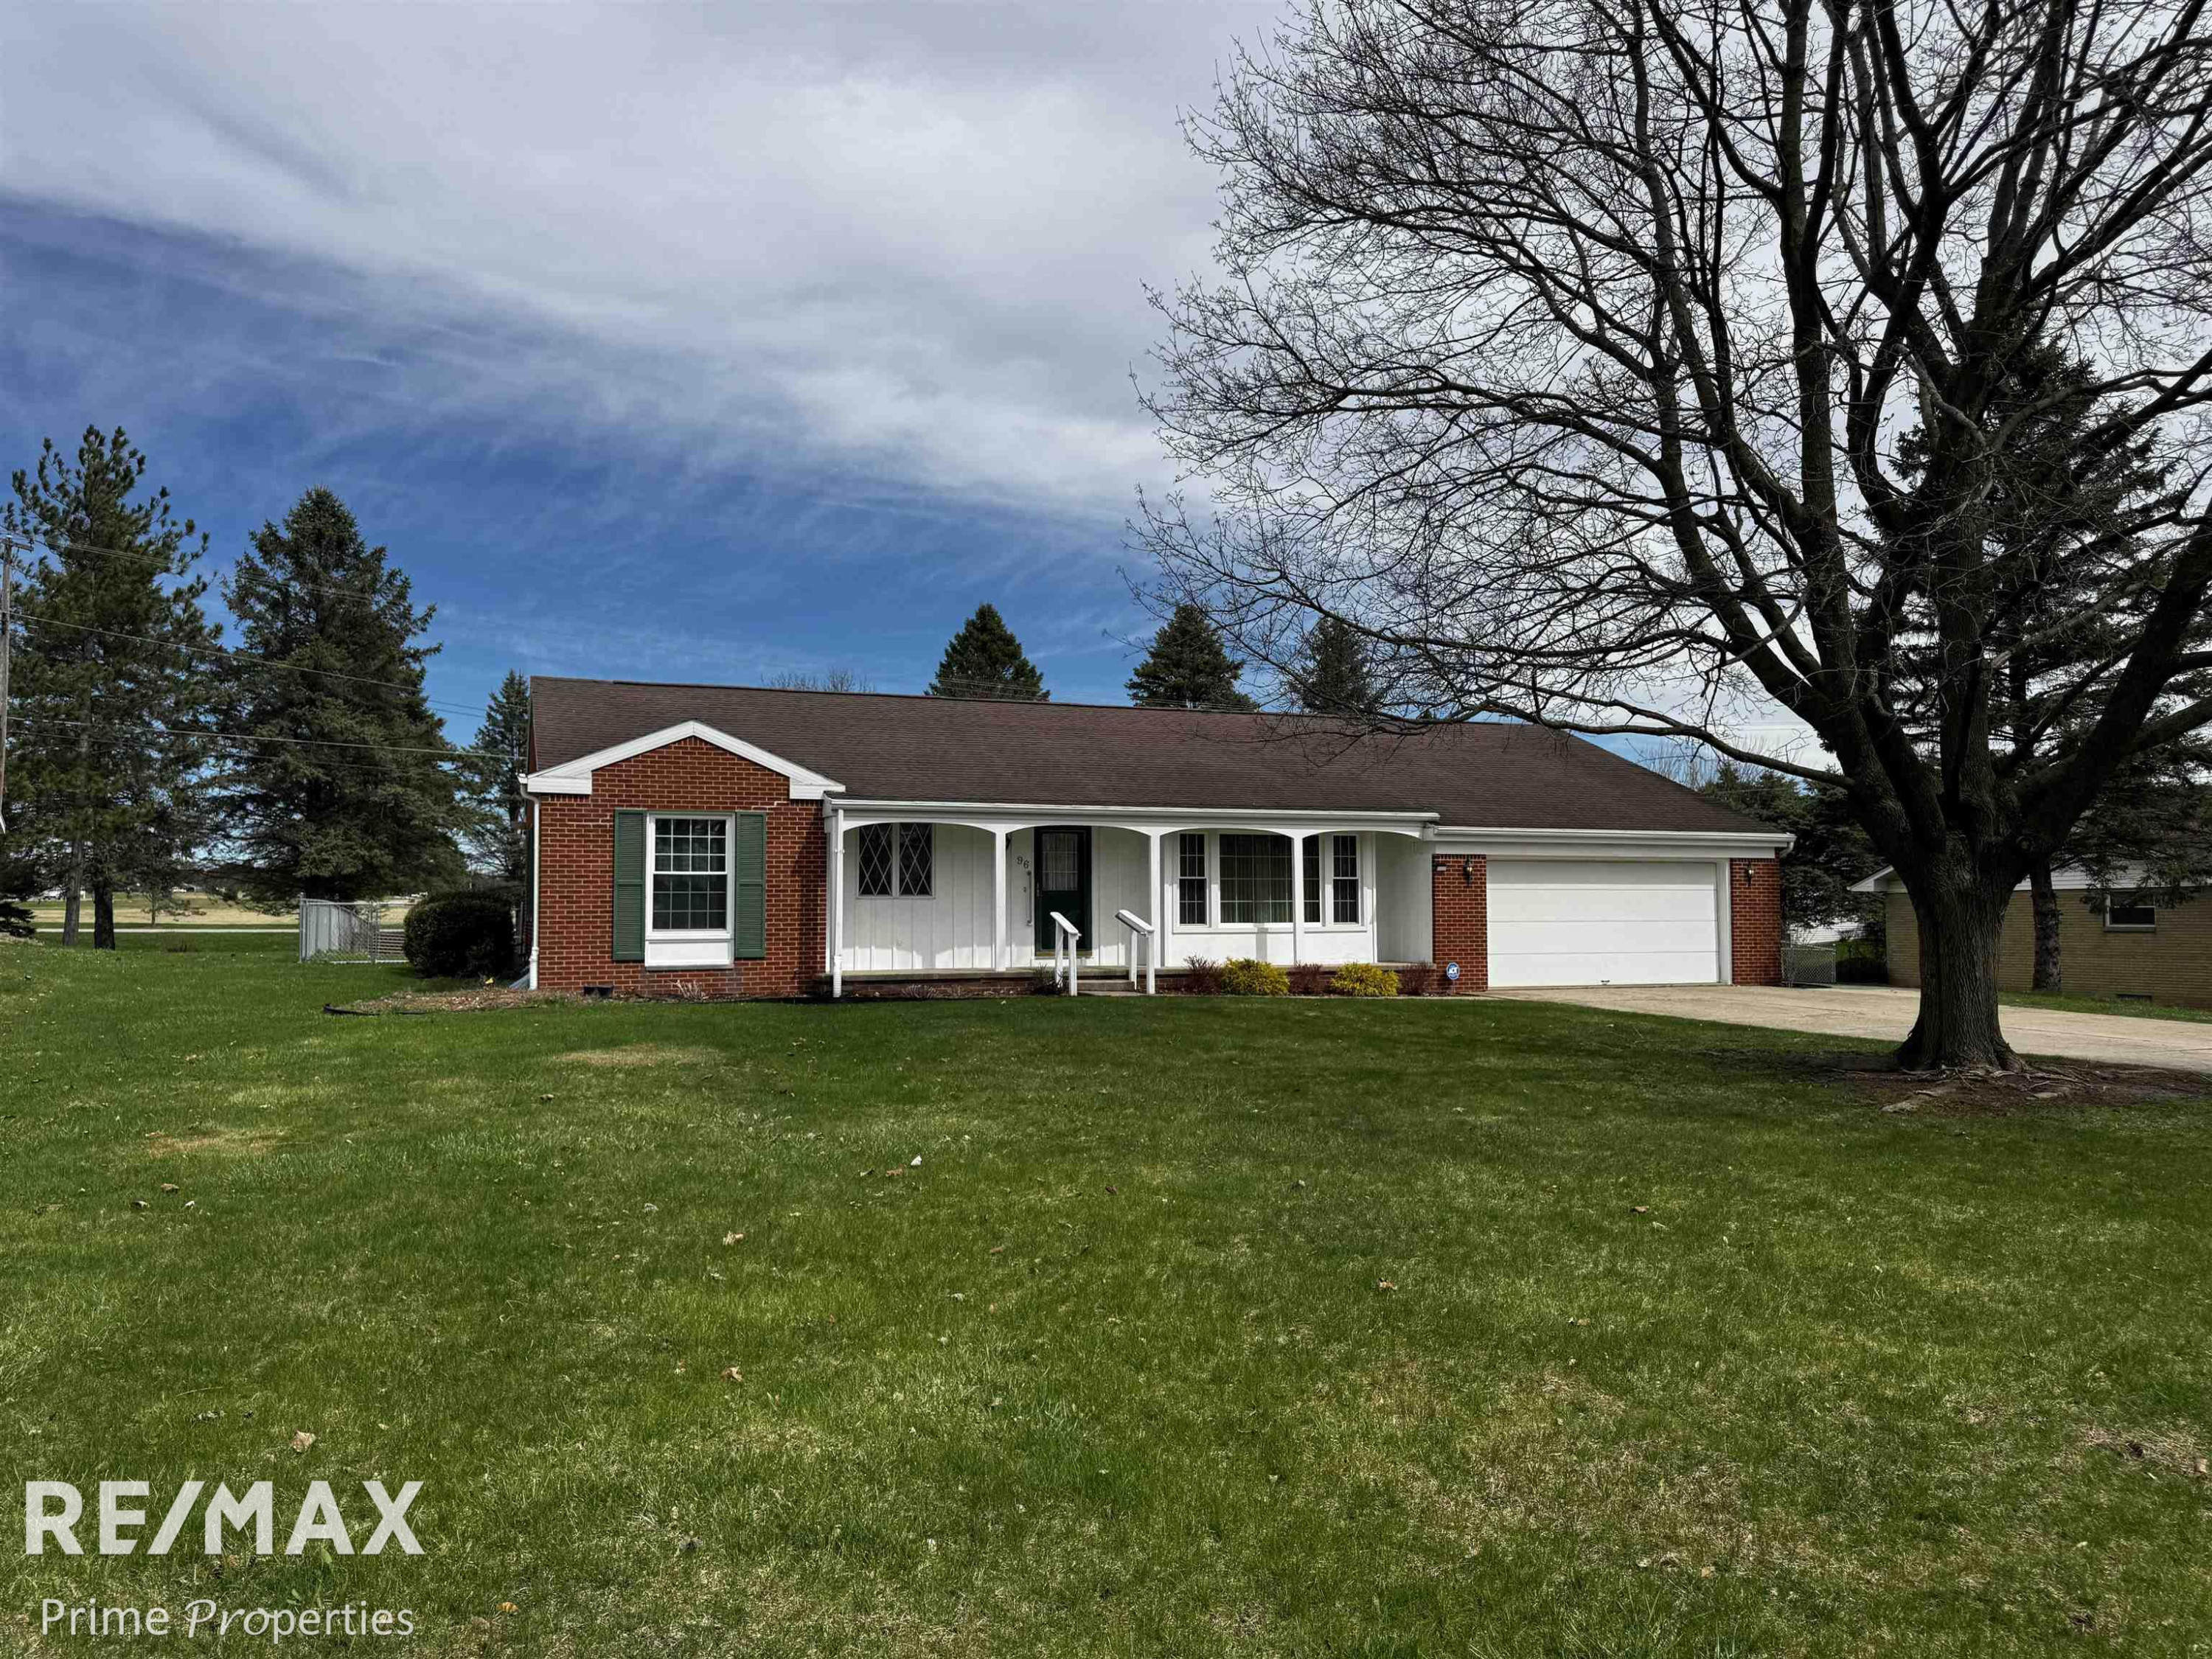
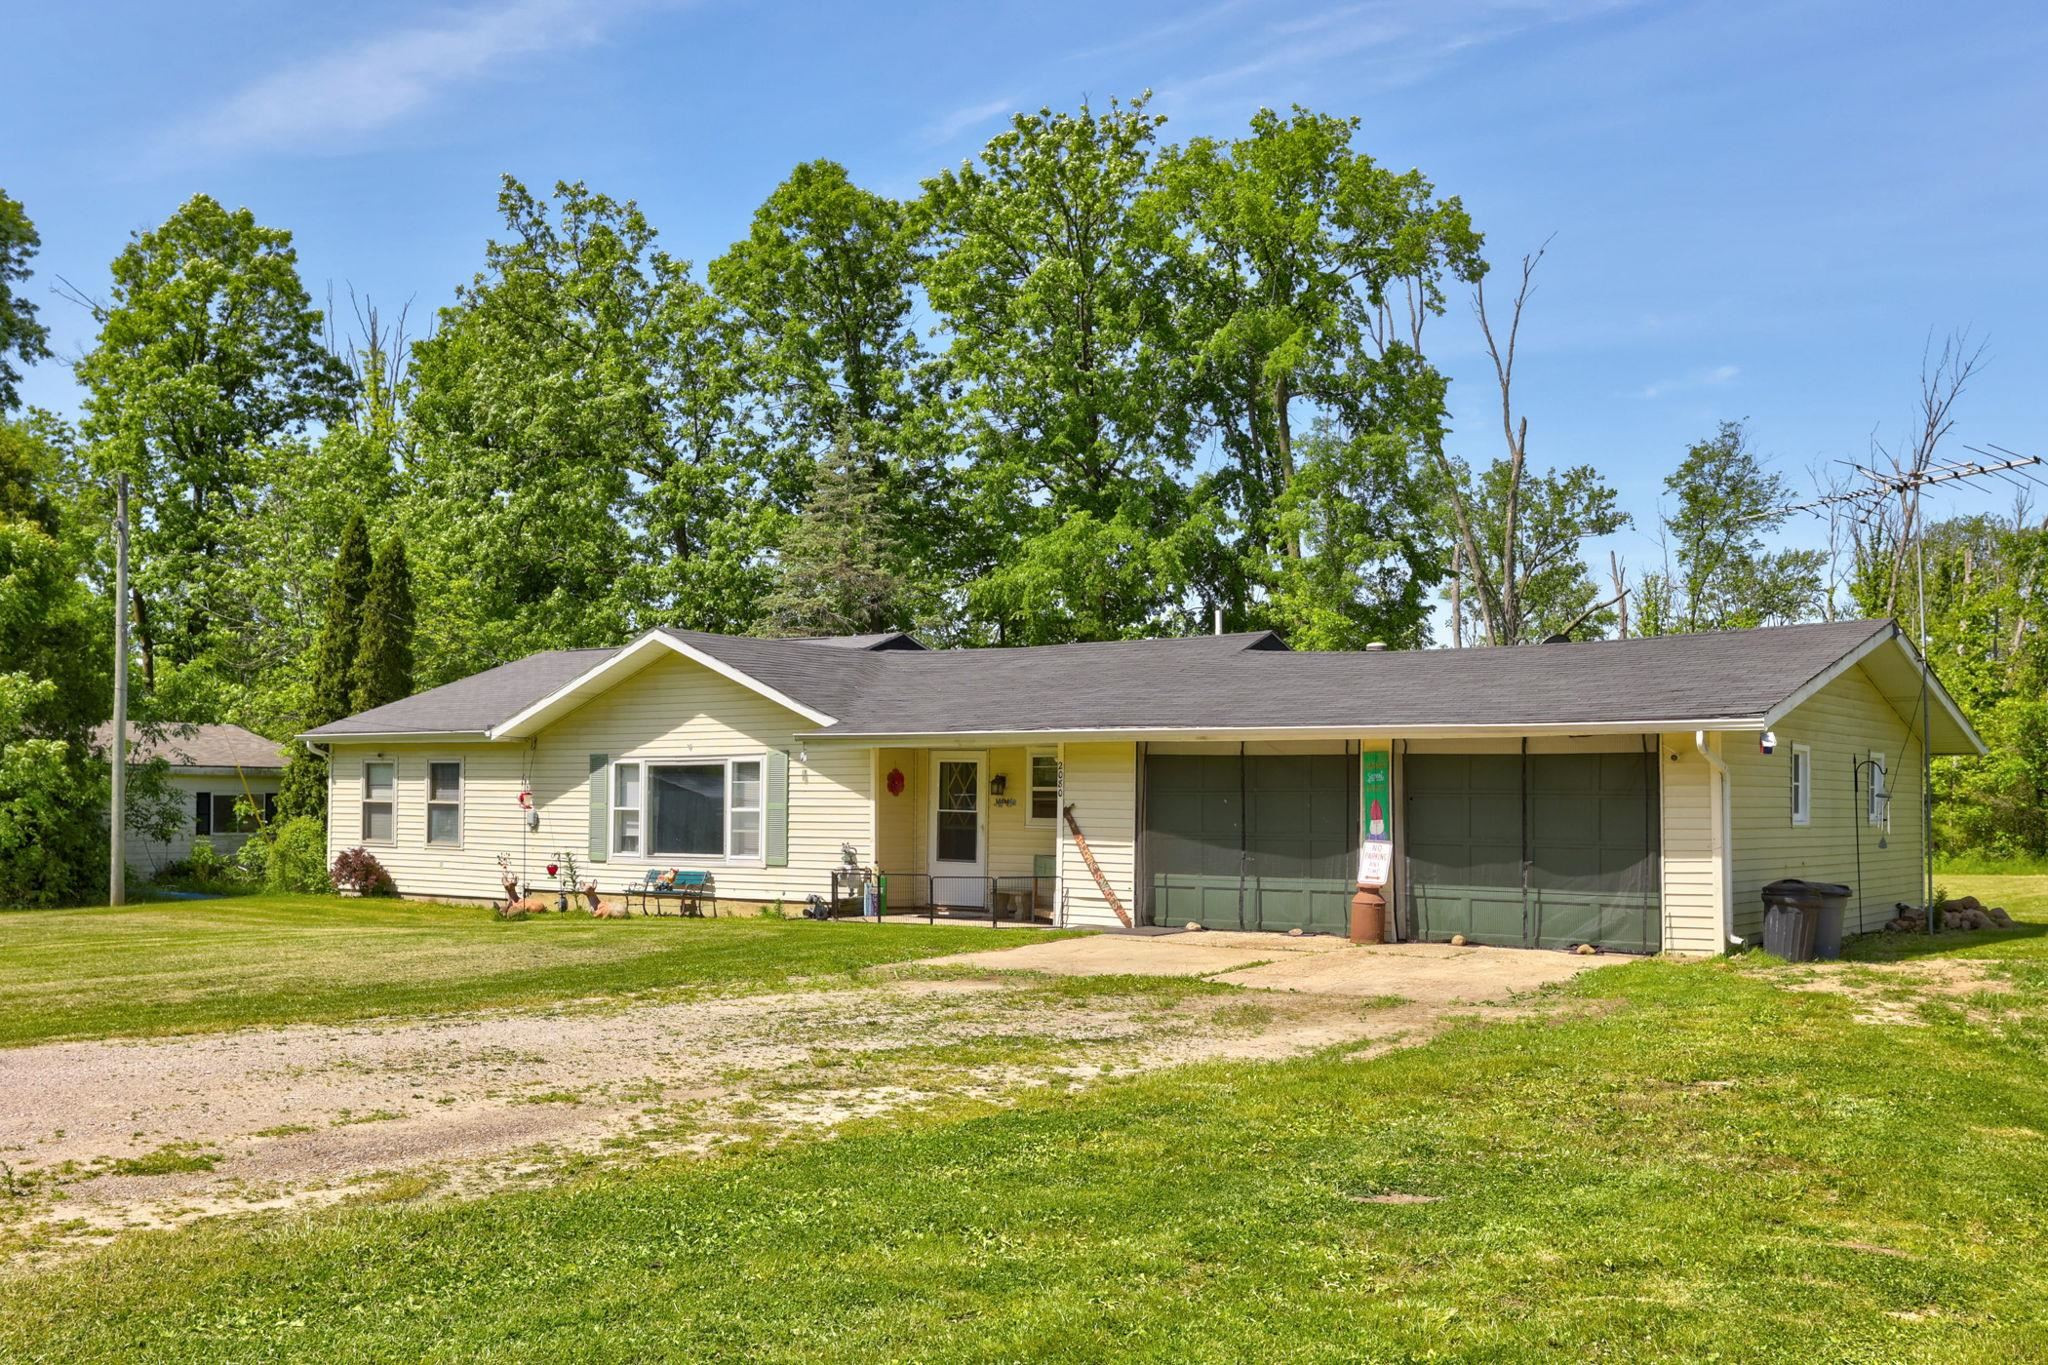
96 Rodd Drive, Caro, MI 48723
3 bd2 ba1.29 ac
Single Family
Under Contract
1/38
$279,900
1120 Northview Drive, Caro, MI 48723
5 bd3 ba2,860 sqft1.83 ac
Single Family
For Sale
1/24
$279,900
315 Romain Road, Caro, MI 48723
2 bd2 ba1,968 sqft0.90 ac
Single Family
For Sale
1/20
$254,900
3473 Mertz Road, Caro, MI 48723
3 bd2 ba1,500 sqft2.13 ac
Single Family
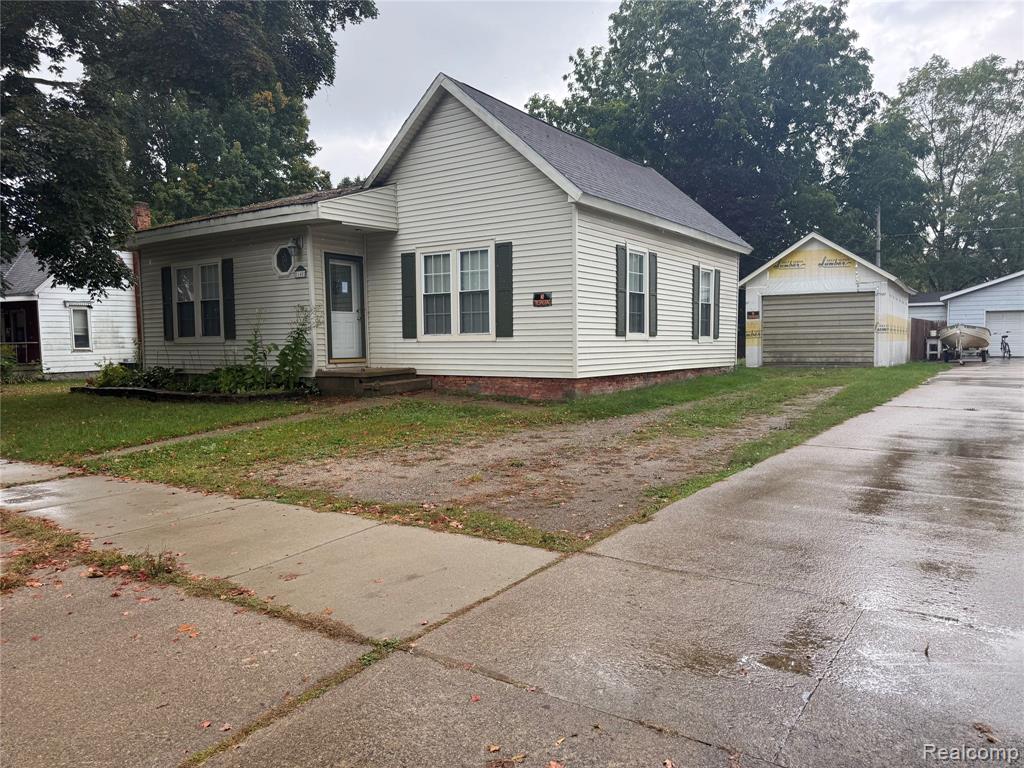
For Sale
1/71
$249,900
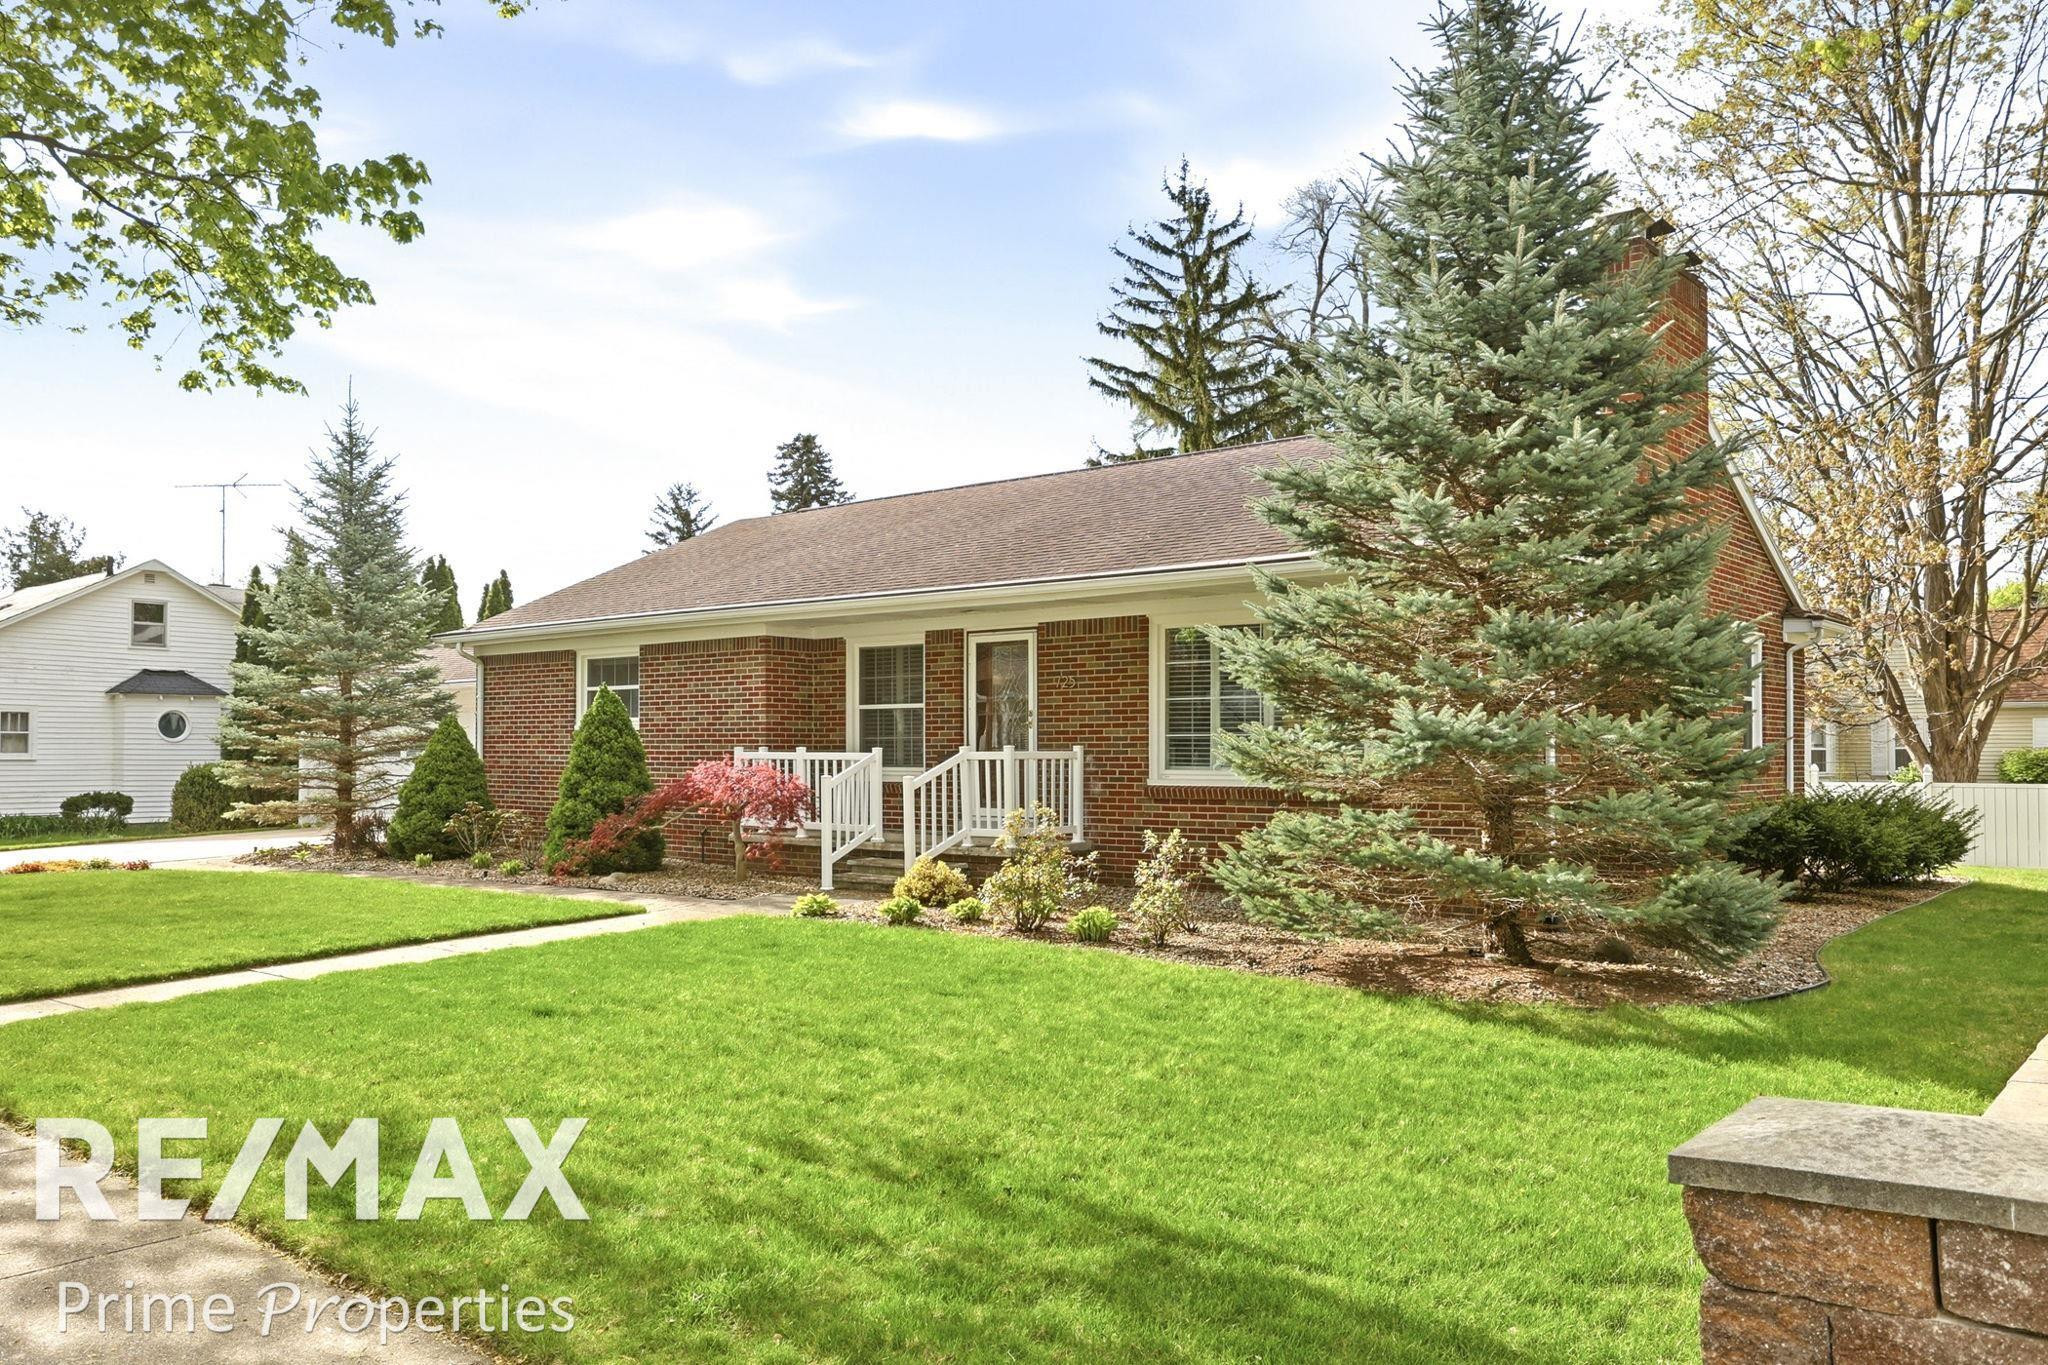
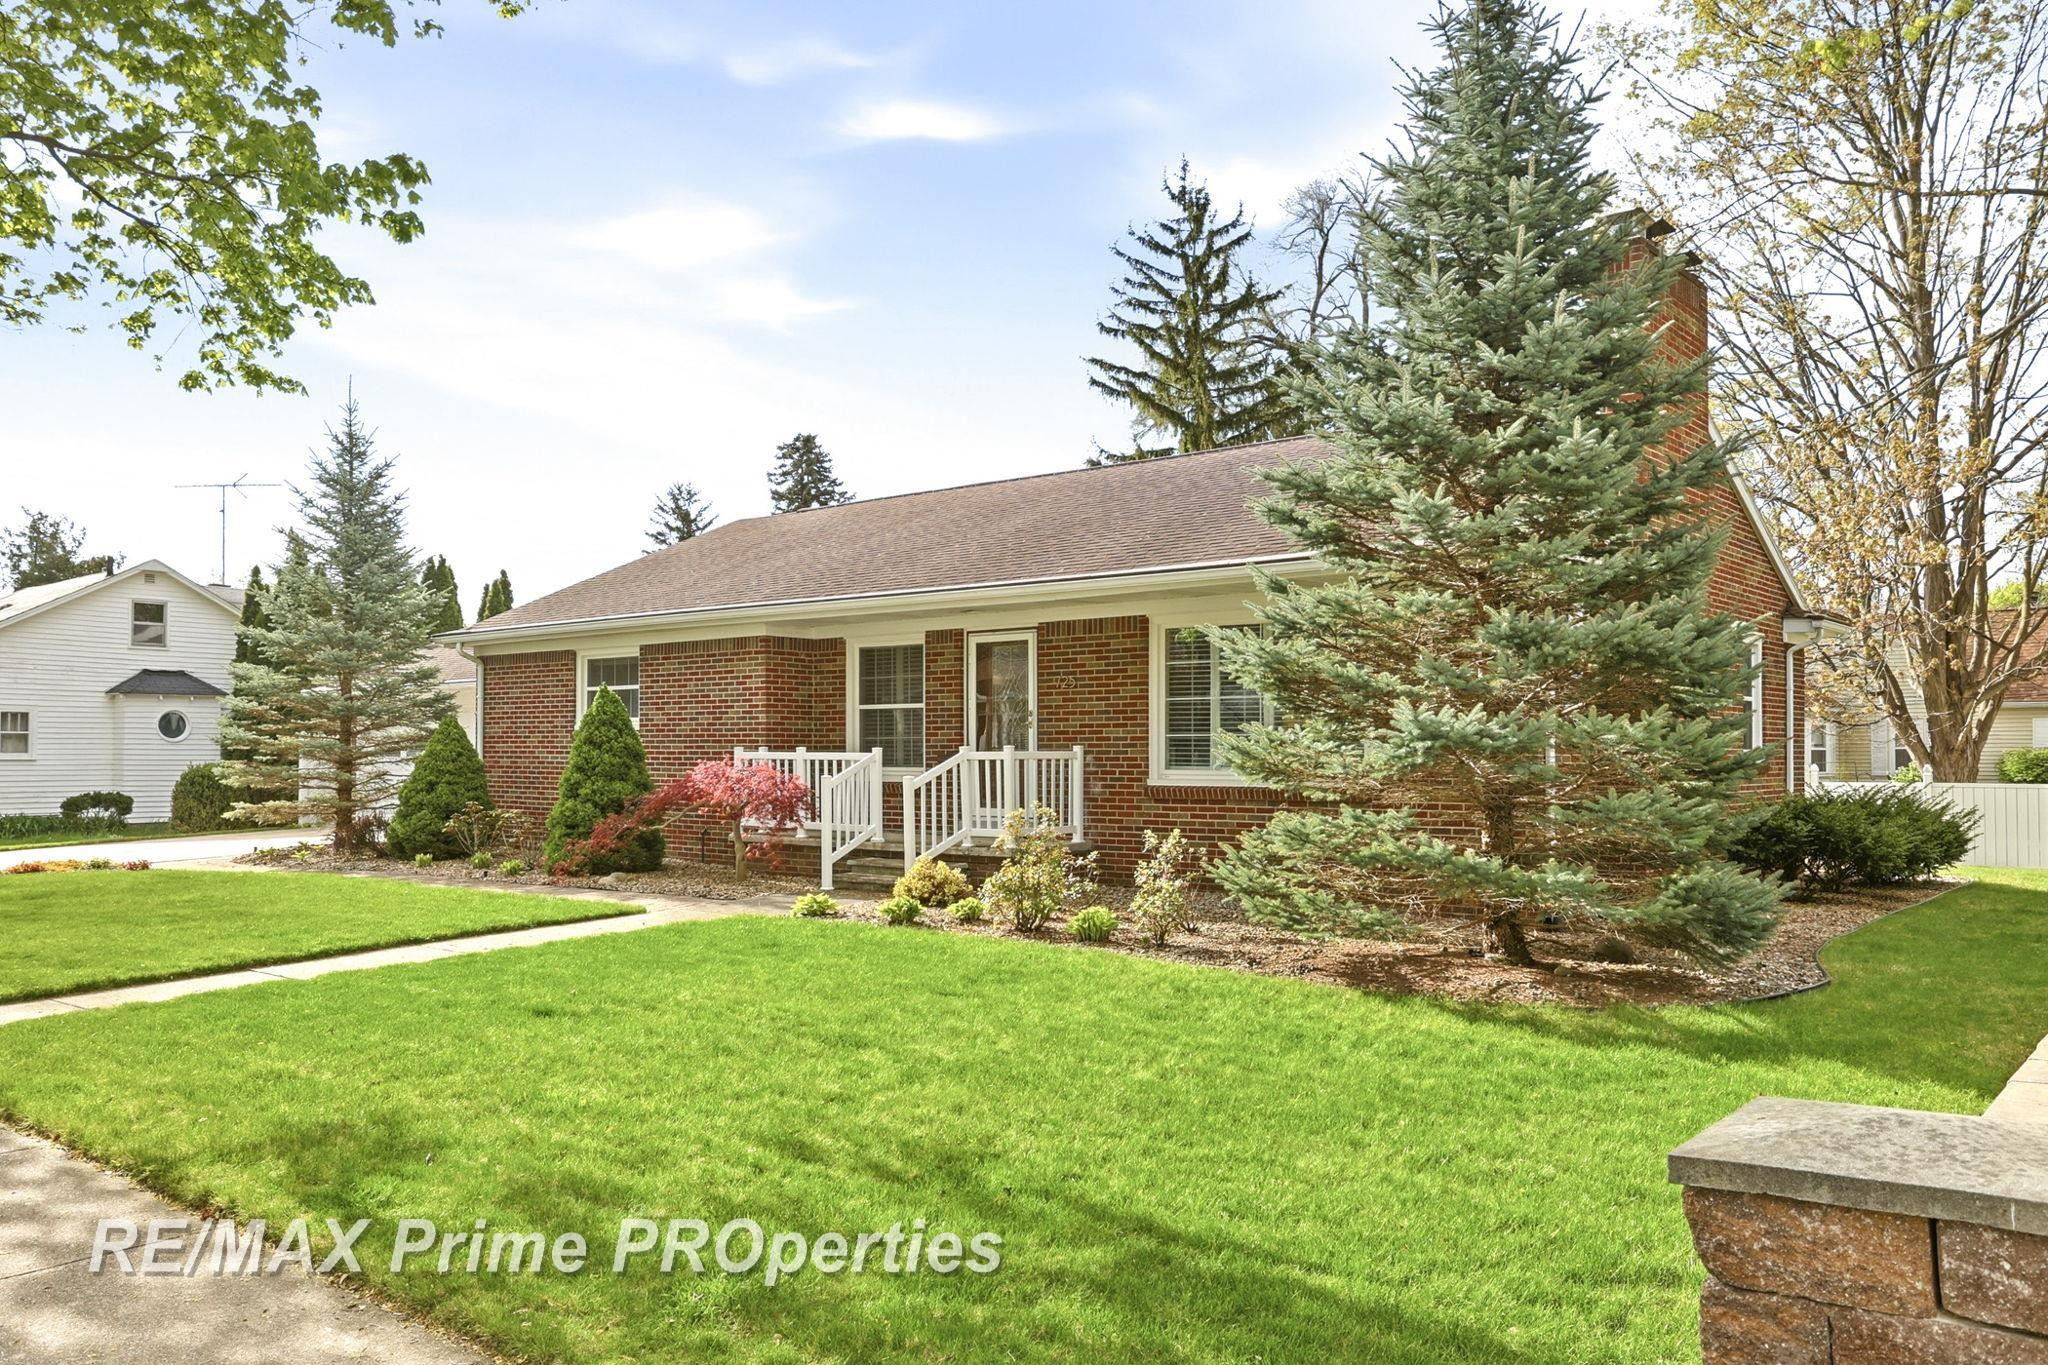
725 W Frank Street, Caro, MI 48723
4 bd2 ba0.23 ac
Single Family
For Sale
1/72
$249,900
725 W Frank Street, Caro, MI 48723
4 bd2 ba0.23 ac
Single Family
For Sale
1/30
$210,000
2455 Jacob Road, Caro, MI 48723
3 bd1 ba1,476 sqft2 ac
Single Family
For Sale
1/50
$210,000
2905 S Plain Road, Caro, MI 48723
3 bd2 ba1,188 sqft10.52 ac
Mfg Home
For Sale
1/12
$180,000
2325 Mertz Road, Caro, MI 48723
3 bd2 ba2,100 sqft1 ac
Single Family
For Sale
1/35
$170,000
2080 S Sheridan Road, Caro, MI 48723
3 bd1 ba1.18 ac
Single Family
For Sale
1/18
$169,900
1429 E Caro Road, Caro, MI 48723
3 bd2 ba1,744 sqft0.97 ac
Single Family
For Sale
1/28
$159,000
140 Alexander Street, Caro, MI 48723
3 bd1 ba1,500 sqft0.14 ac
Single Family
For Sale
1/44
$129,900
201 S Almer Street, Caro, MI 48723
2 bd2 ba1,491 sqft0.30 ac
Single Family
For Sale
1/26
$109,900
608 E Frank Street, Caro, MI 48723
3 bd1 ba1,590 sqft0.15 ac
Single Family
For Sale
1/31
$99,900
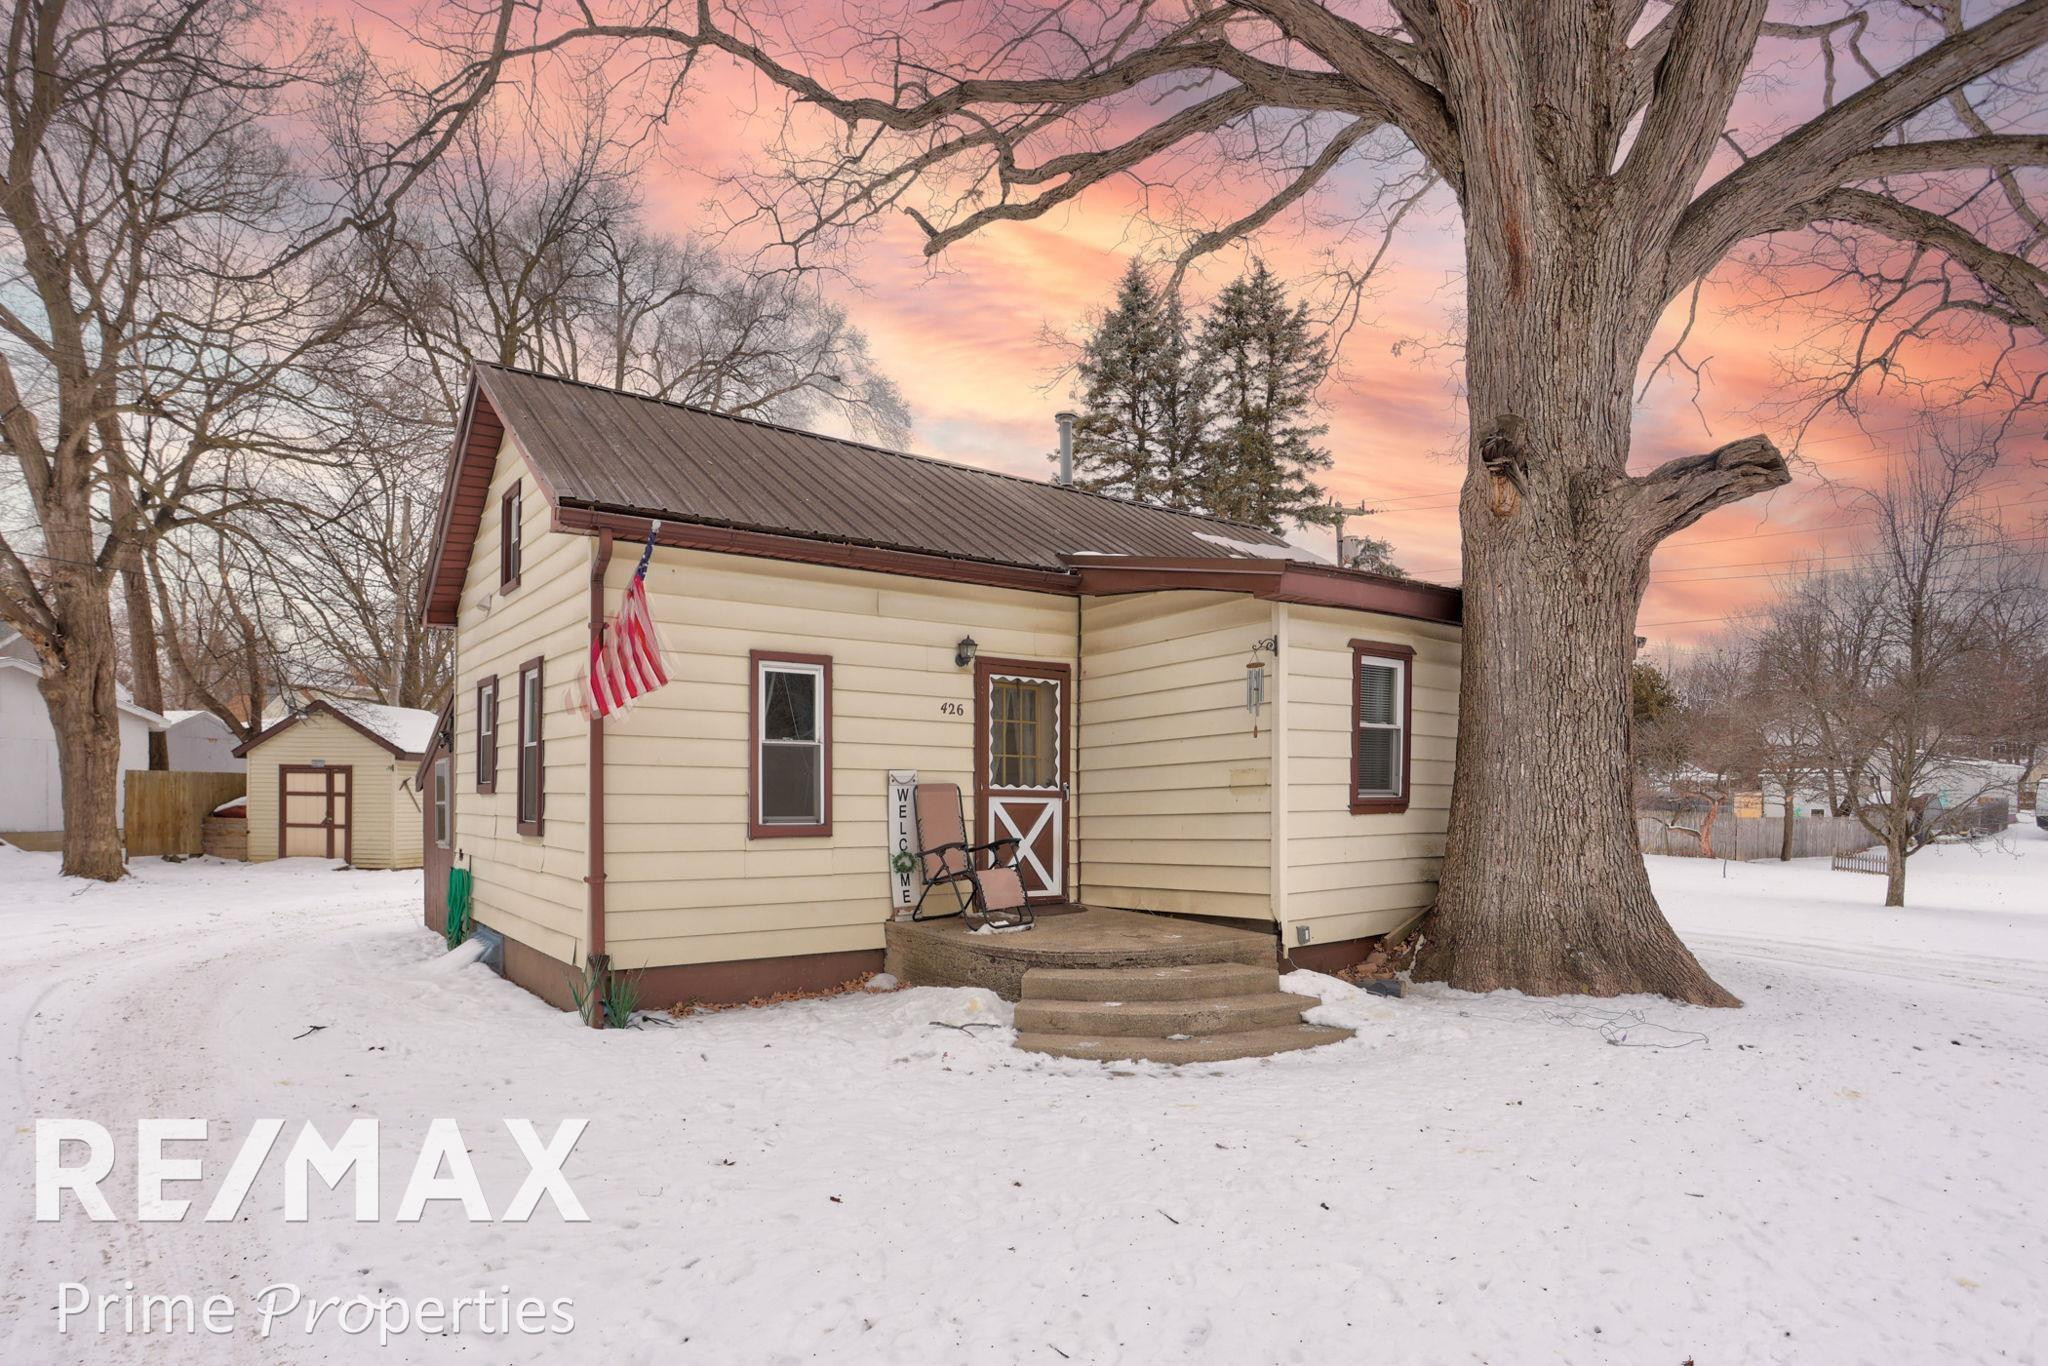
426 Bates Street, Caro, MI 48723
2 bd1 ba0.23 ac
Single Family
For Sale
1/16
$99,500
100 S Hooper Street, Caro, MI 48723
1 bd1 ba943 sqft1.80 ac
Single Family
Recently Sold(50)
Frequently Asked Questions about Caro
How many homes are for sale in Caro?
Buyers in Caro can choose from 19 active listings. The median asking price is $210,000.
What are home prices like in Caro?
The median sale price in Caro is $210,000, based on 50 closed sales over the past 12 months.
What is the average days on market in Caro?
Homes in Caro sell in an average of 71 days, based on 50 sales over the past 12 months.
Which school districts cover Caro?
Multiple school districts may serve Caro. Michigan school district boundaries are independent of city borders. The school district for a specific property depends on its exact location within the city.
How competitive is the Caro real estate market?
Caro is currently a balanced market, with 4.6 months of supply. That ratio comes from 19 active listings relative to 50 sales per year.
How are property taxes calculated in Caro?
Property taxes in Caro are based on a property's State Equalized Value (SEV), which is roughly 50% of market value, multiplied by the local millage rate. Homestead properties (primary residences) receive a lower rate than non-homestead. Tax bills are split into summer and winter installments.
What does demographic data show about housing demand in Caro?
Based on Census Bureau ACS 5-Year Estimates, the Household Formation Gap in Caro is +8.6%. Shrinking household sizes (from 2.37 to 2.18 persons per household) have increased the number of households needing housing by 155 since 2009 — independent of the 0.1% population decline. This is a secondary demographic indicator, not a primary market measure.