Mount Pleasant Real Estate
17 active listings · 59 sold in the past 12mo
$210,000
Median List Price
59
Sold (past 12mo)
60
Avg Days on Market
-14.3%
HFGⓘ
Household Formation Gap (HFG) is a secondary market indicator that measures hidden housing demand created by shrinking household sizes. As average household size decreases — due to divorce, single living, empty nesting, delayed marriage — more housing units are needed even without population growth. HFG compares the estimated number of households needed today versus 15 years ago: (population ÷ avg household size). This is a demographic trend signal, not a primary market indicator like income-based affordability or comparative market analysis. Source: U.S. Census Bureau, American Community Survey 5-Year Estimates (2009–2023), Tables B01003, B25010, B25001.
Active Listings
Loading map…
Market Dashboard
Homes for Sale(17)
View all with filters →
For Sale
1/55
$585,000
3159 Hilltop Lane, Mount Pleasant, MI 48858
2 bd3 ba3,544 sqft1.60 ac
Single Family
For Sale
1/43
$360,000
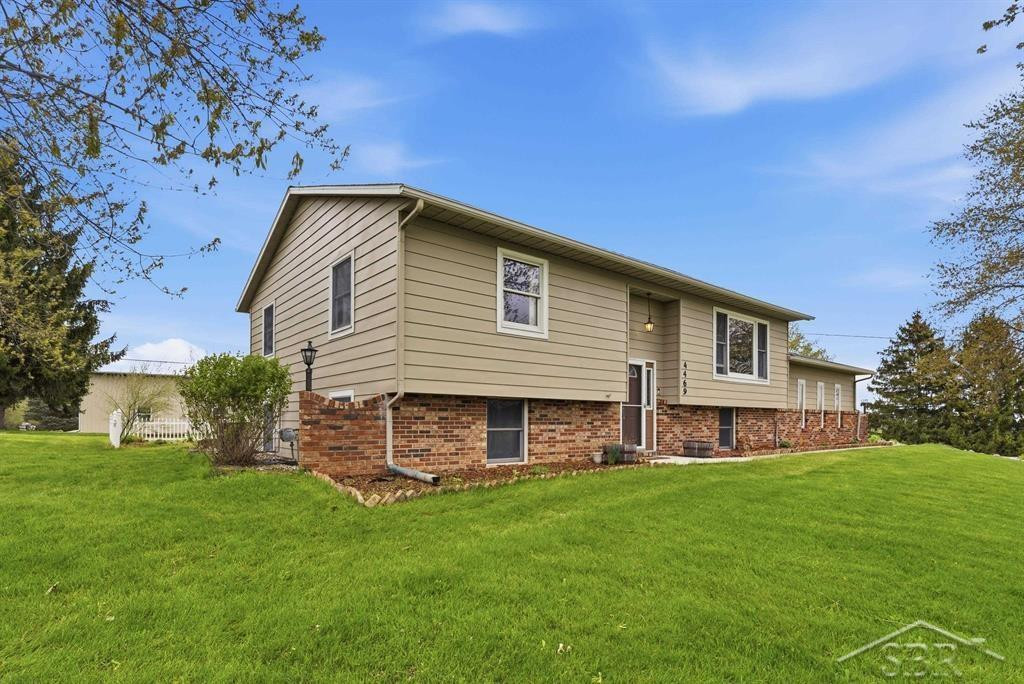
4469 E Millbrook Road, Mount Pleasant, MI 48858
5 bd3 ba1.06 ac
Single Family

For Sale
1/49
$349,900
1716 Heritage Way, MI 48858
3 bd3 ba0.16 ac
Condo

For Sale
1/38
$329,000
2774 Bilbrael Drive, Mount Pleasant, MI 48858
3 bd2 ba1,556 sqft0.66 ac
Single Family

For Sale
1/16
$319,900
8653 E Remus Road, Mount Pleasant, MI 48858
2 bd1 ba720 sqft39 ac
Mfg Home

For Sale
1/34
$284,900
1955 E River Road, MI 48858
3 bd1 ba0.95 ac
Single Family

Under Contract
1/50
$265,000
910 Elizabeth Court, Mount Pleasant, MI 48858
5 bd3 ba2,594 sqft0.22 ac
Single Family

For Sale
1/23
$250,000
1637 chippewa Way, Mount Pleasant, MI 48858
3 bd3 ba1,970 sqft0.16 ac
Condo

For Sale
1/32
$210,000
1208 W Broadway Street, Mount Pleasant, MI 48858
3 bd1 ba1,000 sqft0.28 ac
Single Family
For Sale
1/27
$189,900
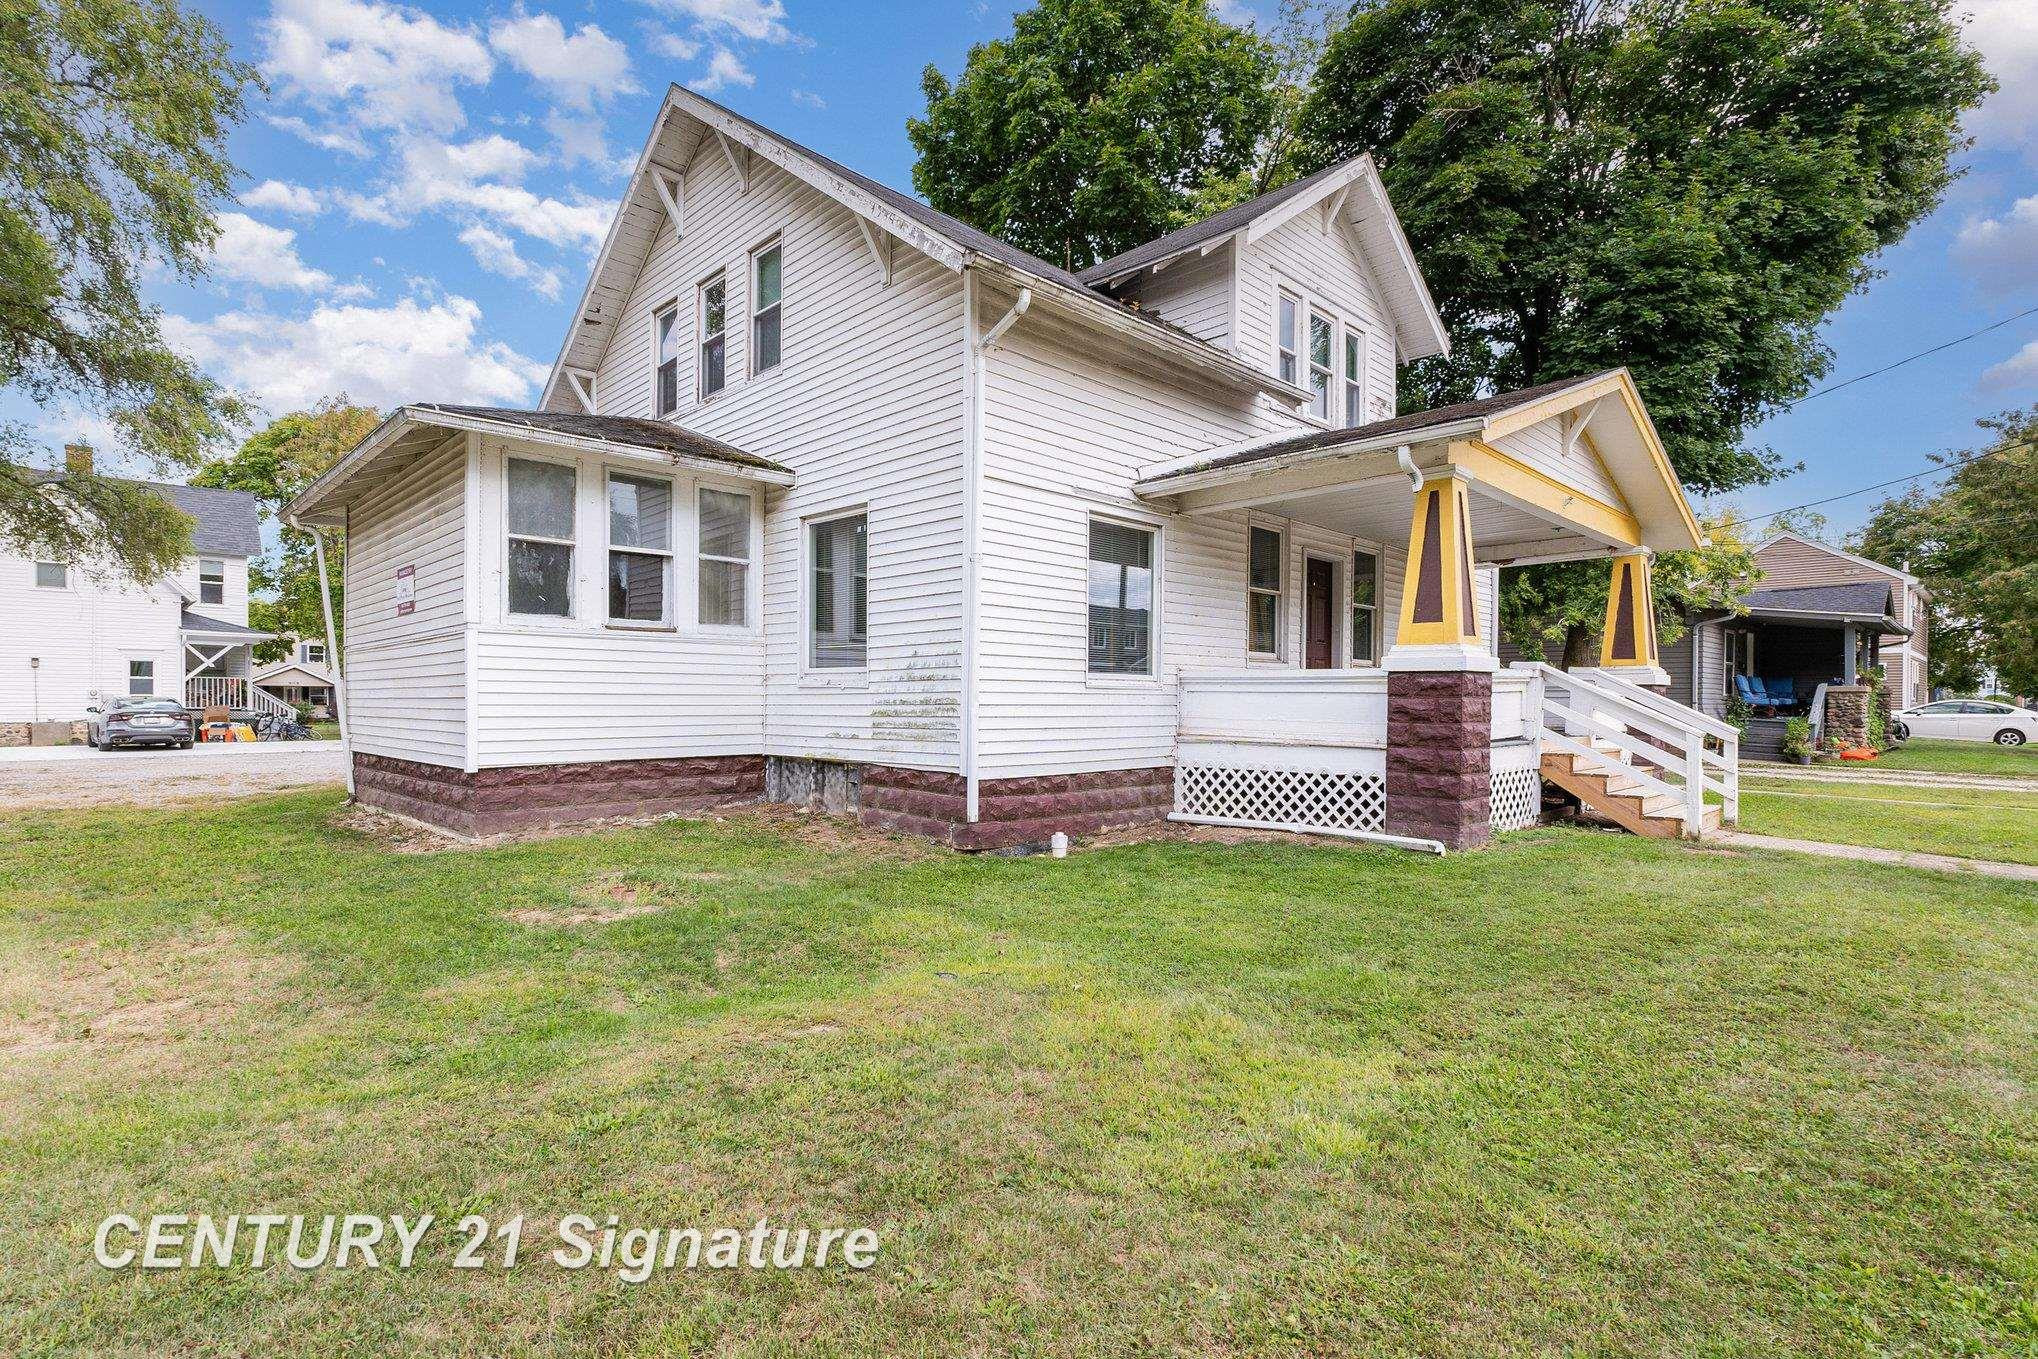
805 S Douglas Street, 805 1/2 Douglas, Mount Pleasant, MI 48858
0.23 ac
Multi-Fam

For Sale
1/47
$186,000
617 S Lansing Street, Mount Pleasant, MI 48858
3 bd1 ba1,435 sqft0.30 ac
Single Family
For Sale
1/18
$170,000
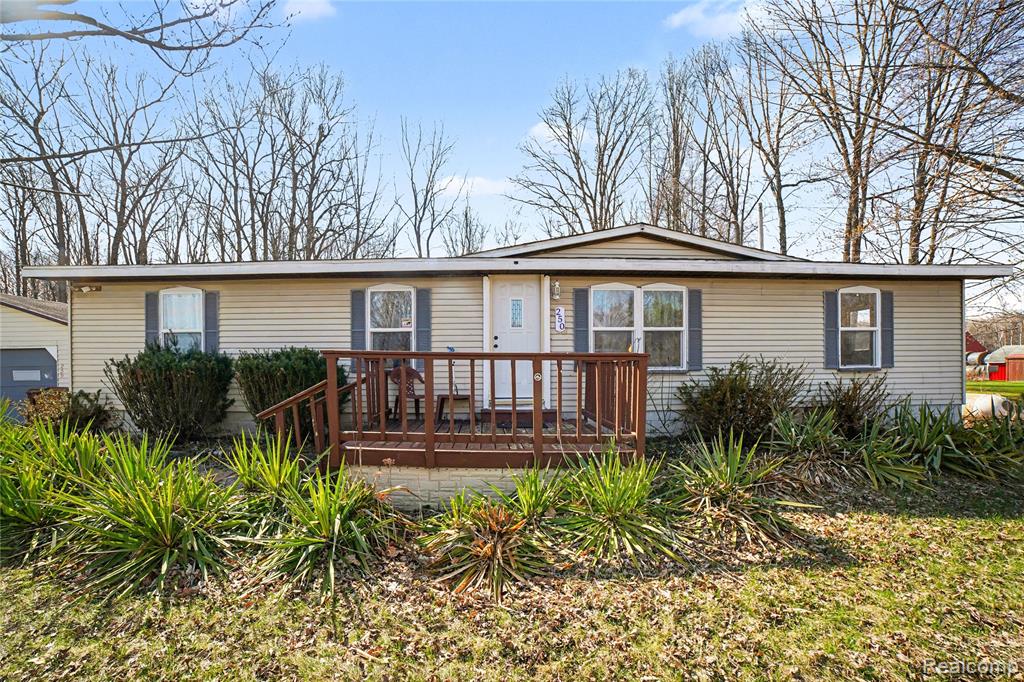
250 S Leaton Road, Mount Pleasant, MI 48858
3 bd2 ba1,500 sqft1 ac
Single Family
For Sale
1/12
$164,900
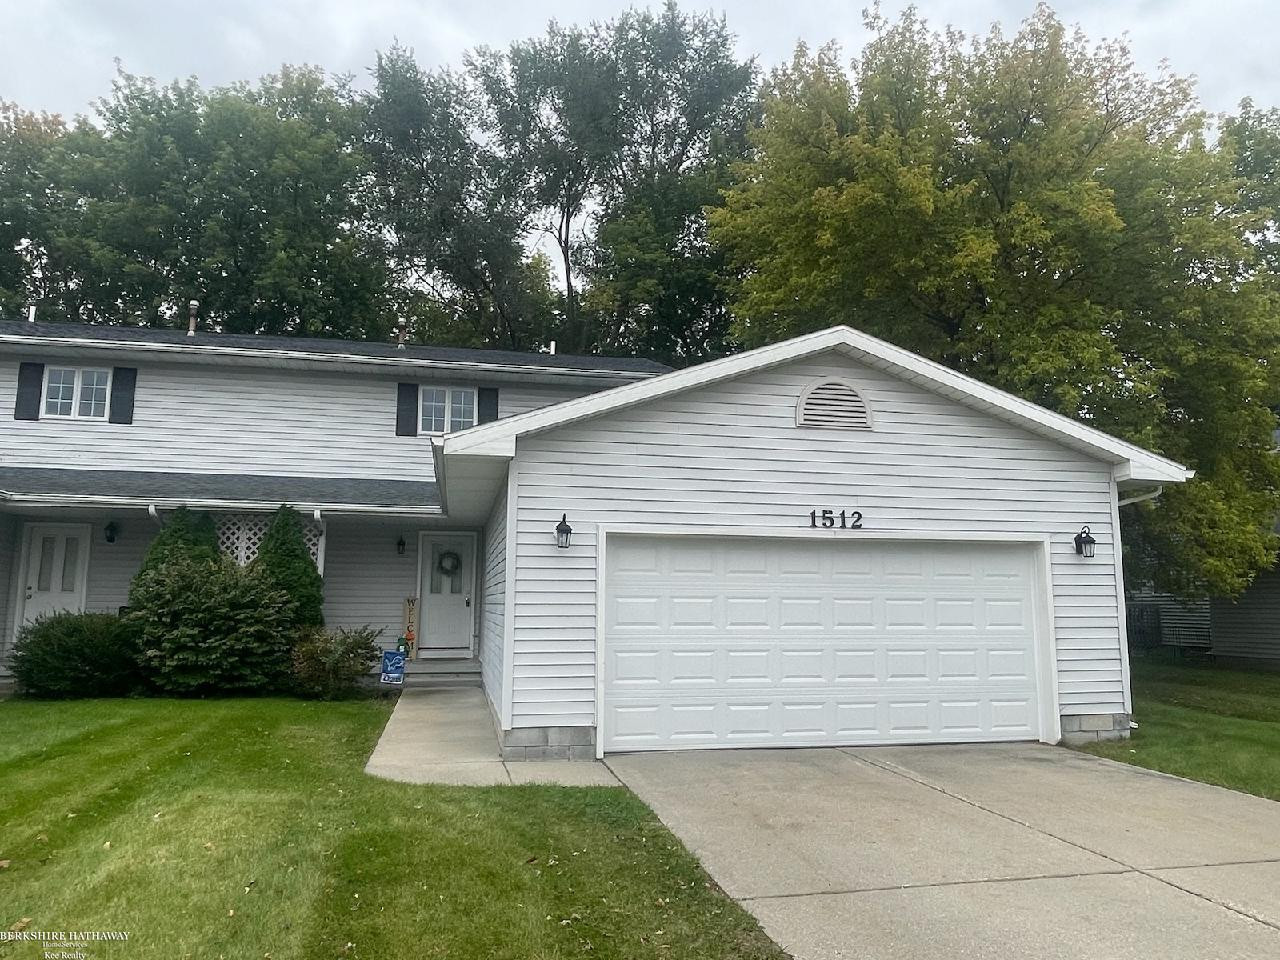
1512 E Gaylord Street, 7, Mount Pleasant, MI 48858
2 bd1 ba
Condo

For Sale
$149,900
1109 Robert Street, Mount Pleasant, MI 48858
3 bd1 ba868 sqft0.18 ac
Single Family

For Sale
1/14
$42,500
2330 Theatre Trail Lot 53, Mount Pleasant, MI 48858
3 bd2 ba720 sqft
Mfg Home

For Sale
1/14
$42,500
2300 Drive In Lane Lot 32, Mount Pleasant, MI 48858
3 bd2 ba720 sqft
Mfg Home

For Sale
1/19
$39,000
2261 Drive In Lane Lot 68, Mount Pleasant, MI 48858
3 bd2 ba720 sqft
Mfg Home
Recently Sold(59)
Frequently Asked Questions about Mount Pleasant
Are there homes available in Mount Pleasant right now?
Buyers in Mount Pleasant can choose from 17 active listings. The median asking price is $210,000.
How much do homes cost in Mount Pleasant?
The median sale price in Mount Pleasant is $210,000, based on 59 closed sales over the past 12 months.
How long do homes stay on the market in Mount Pleasant?
Homes in Mount Pleasant sell in an average of 60 days, based on 59 sales over the past 12 months.
What schools are in Mount Pleasant?
Mount Pleasant is served by one or more public school districts. In Michigan, school district boundaries do not always align with city limits, so different parts of Mount Pleasant may be zoned for different districts. Check individual listings for the specific school district assignment.
What are market conditions like in Mount Pleasant?
With 3.5 months of inventory, Mount Pleasant is currently a balanced market. This is based on 17 active listings and 59 sales in the past 12 months.
What are property taxes like in Mount Pleasant?
Michigan property taxes in Mount Pleasant are calculated using the State Equalized Value (SEV) times the local millage rate. Rates vary by school district and municipality. Primary residences qualify for a homestead exemption that reduces the tax rate.
What is the Household Formation Gap in Mount Pleasant?
Per U.S. Census ACS data, Mount Pleasant has a -14.3% Household Formation Gap over the past 15 years, indicating softening demographic demand. Population declined 19.0%, outpacing the effect of shrinking household sizes (2.2 to 2.08). HFG is a secondary market indicator — local conditions and other factors also influence housing demand.