Port Austin Real Estate
9 active listings · 9 sold in the past 12mo
$300,000
Median List Price
9
Sold (past 12mo)
78
Avg Days on Market
+50.0%
HFGⓘ
Household Formation Gap (HFG) is a secondary market indicator that measures hidden housing demand created by shrinking household sizes. As average household size decreases — due to divorce, single living, empty nesting, delayed marriage — more housing units are needed even without population growth. HFG compares the estimated number of households needed today versus 15 years ago: (population ÷ avg household size). This is a demographic trend signal, not a primary market indicator like income-based affordability or comparative market analysis. Source: U.S. Census Bureau, American Community Survey 5-Year Estimates (2009–2023), Tables B01003, B25010, B25001.
Active Listings
Loading map…
Market Dashboard
Homes for Sale(9)
View all with filters →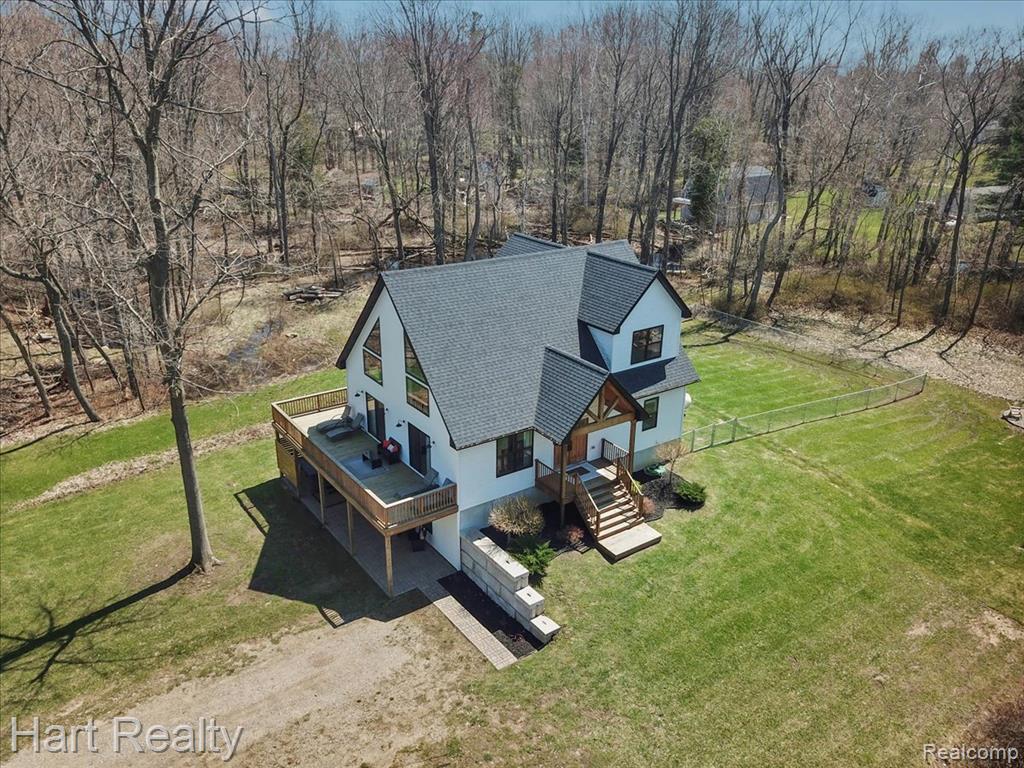
For Sale
1/70
$575,000
3024 Quarry Road, Port Austin, MI 48467
4 bd3 ba3,230 sqft0.62 ac
Single Family
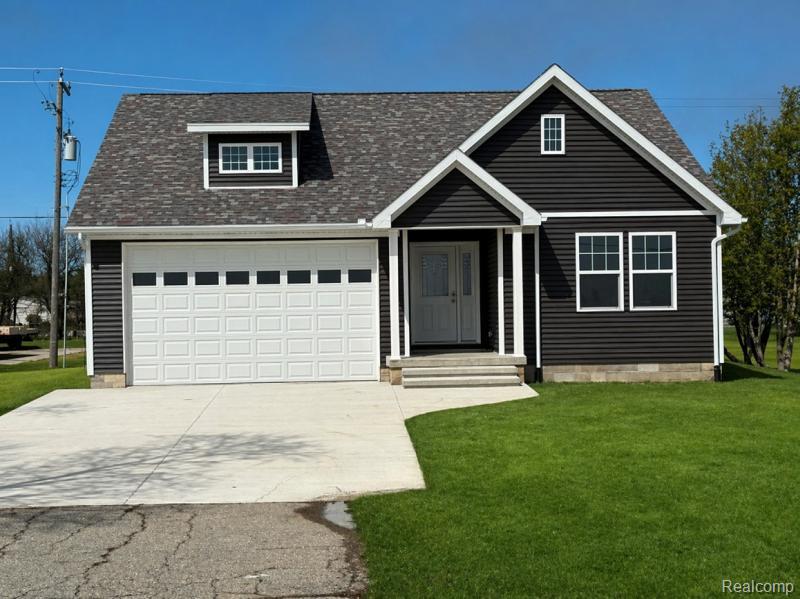
For Sale
1/18
$425,000
399 Grindstone Road, Port Austin, MI 48467
3 bd2 ba1,377 sqft0.42 ac
Single Family

For Sale
1/38
$360,000
119 Union Street, Port Austin, MI 48467
4 bd3 ba1,829 sqft0.20 ac
Single Family
For Sale
1/29
$329,000
977 Port Austin Road, Port Austin, MI 48467
4 bd2 ba1,600 sqft0.33 ac
Single Family
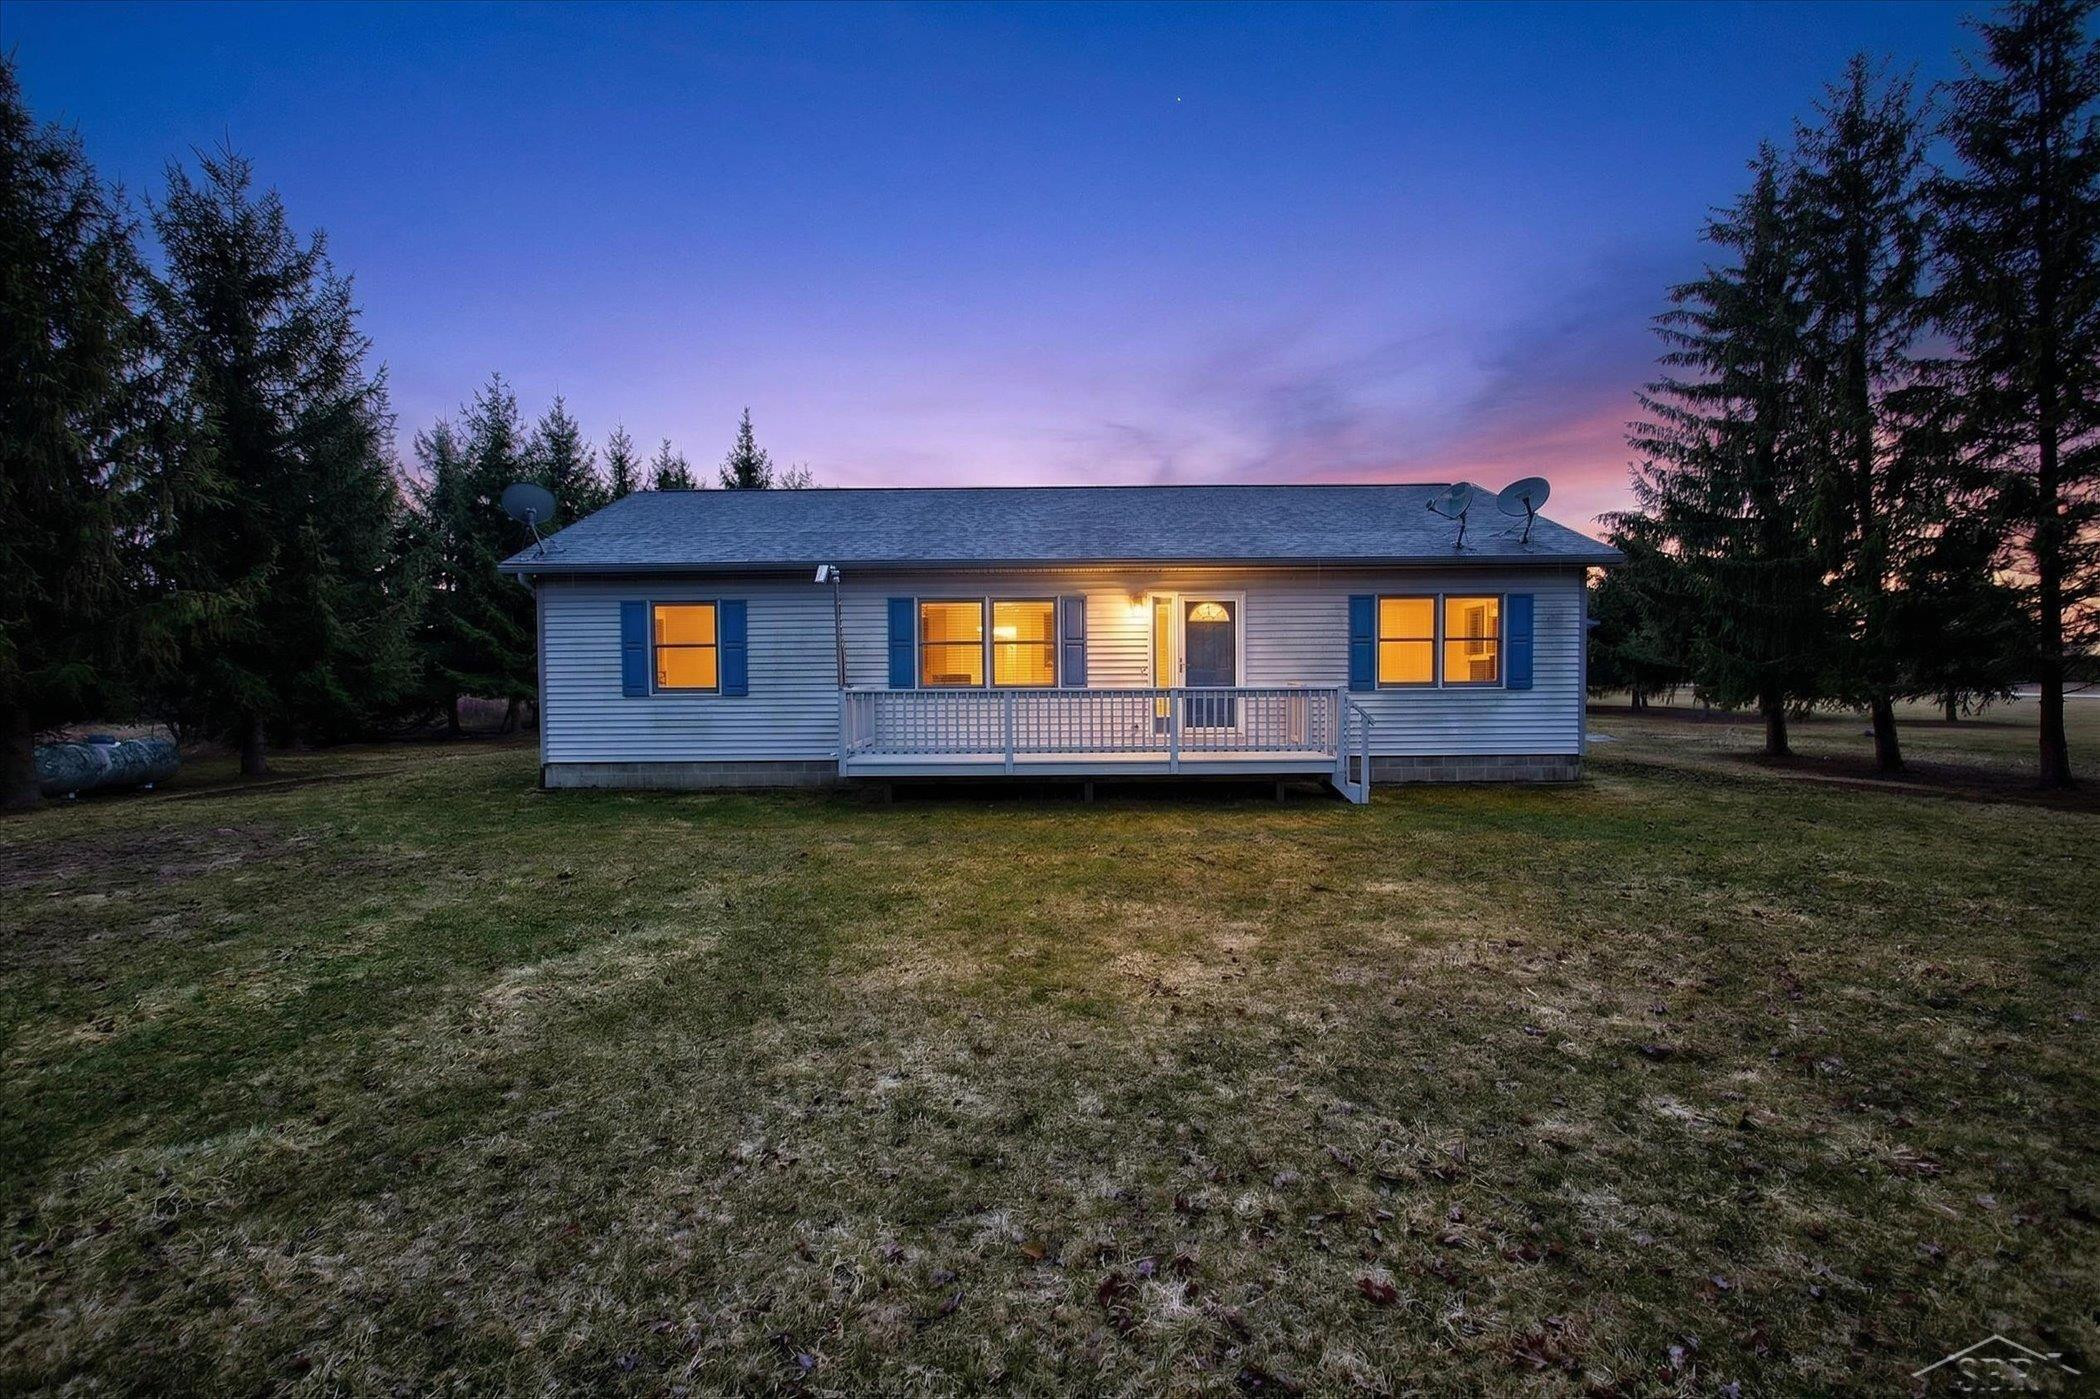
For Sale
1/46
$300,000
9280 N Lakeshore Road, Port Austin, MI 48467
3 bd2 ba1.37 ac
Single Family
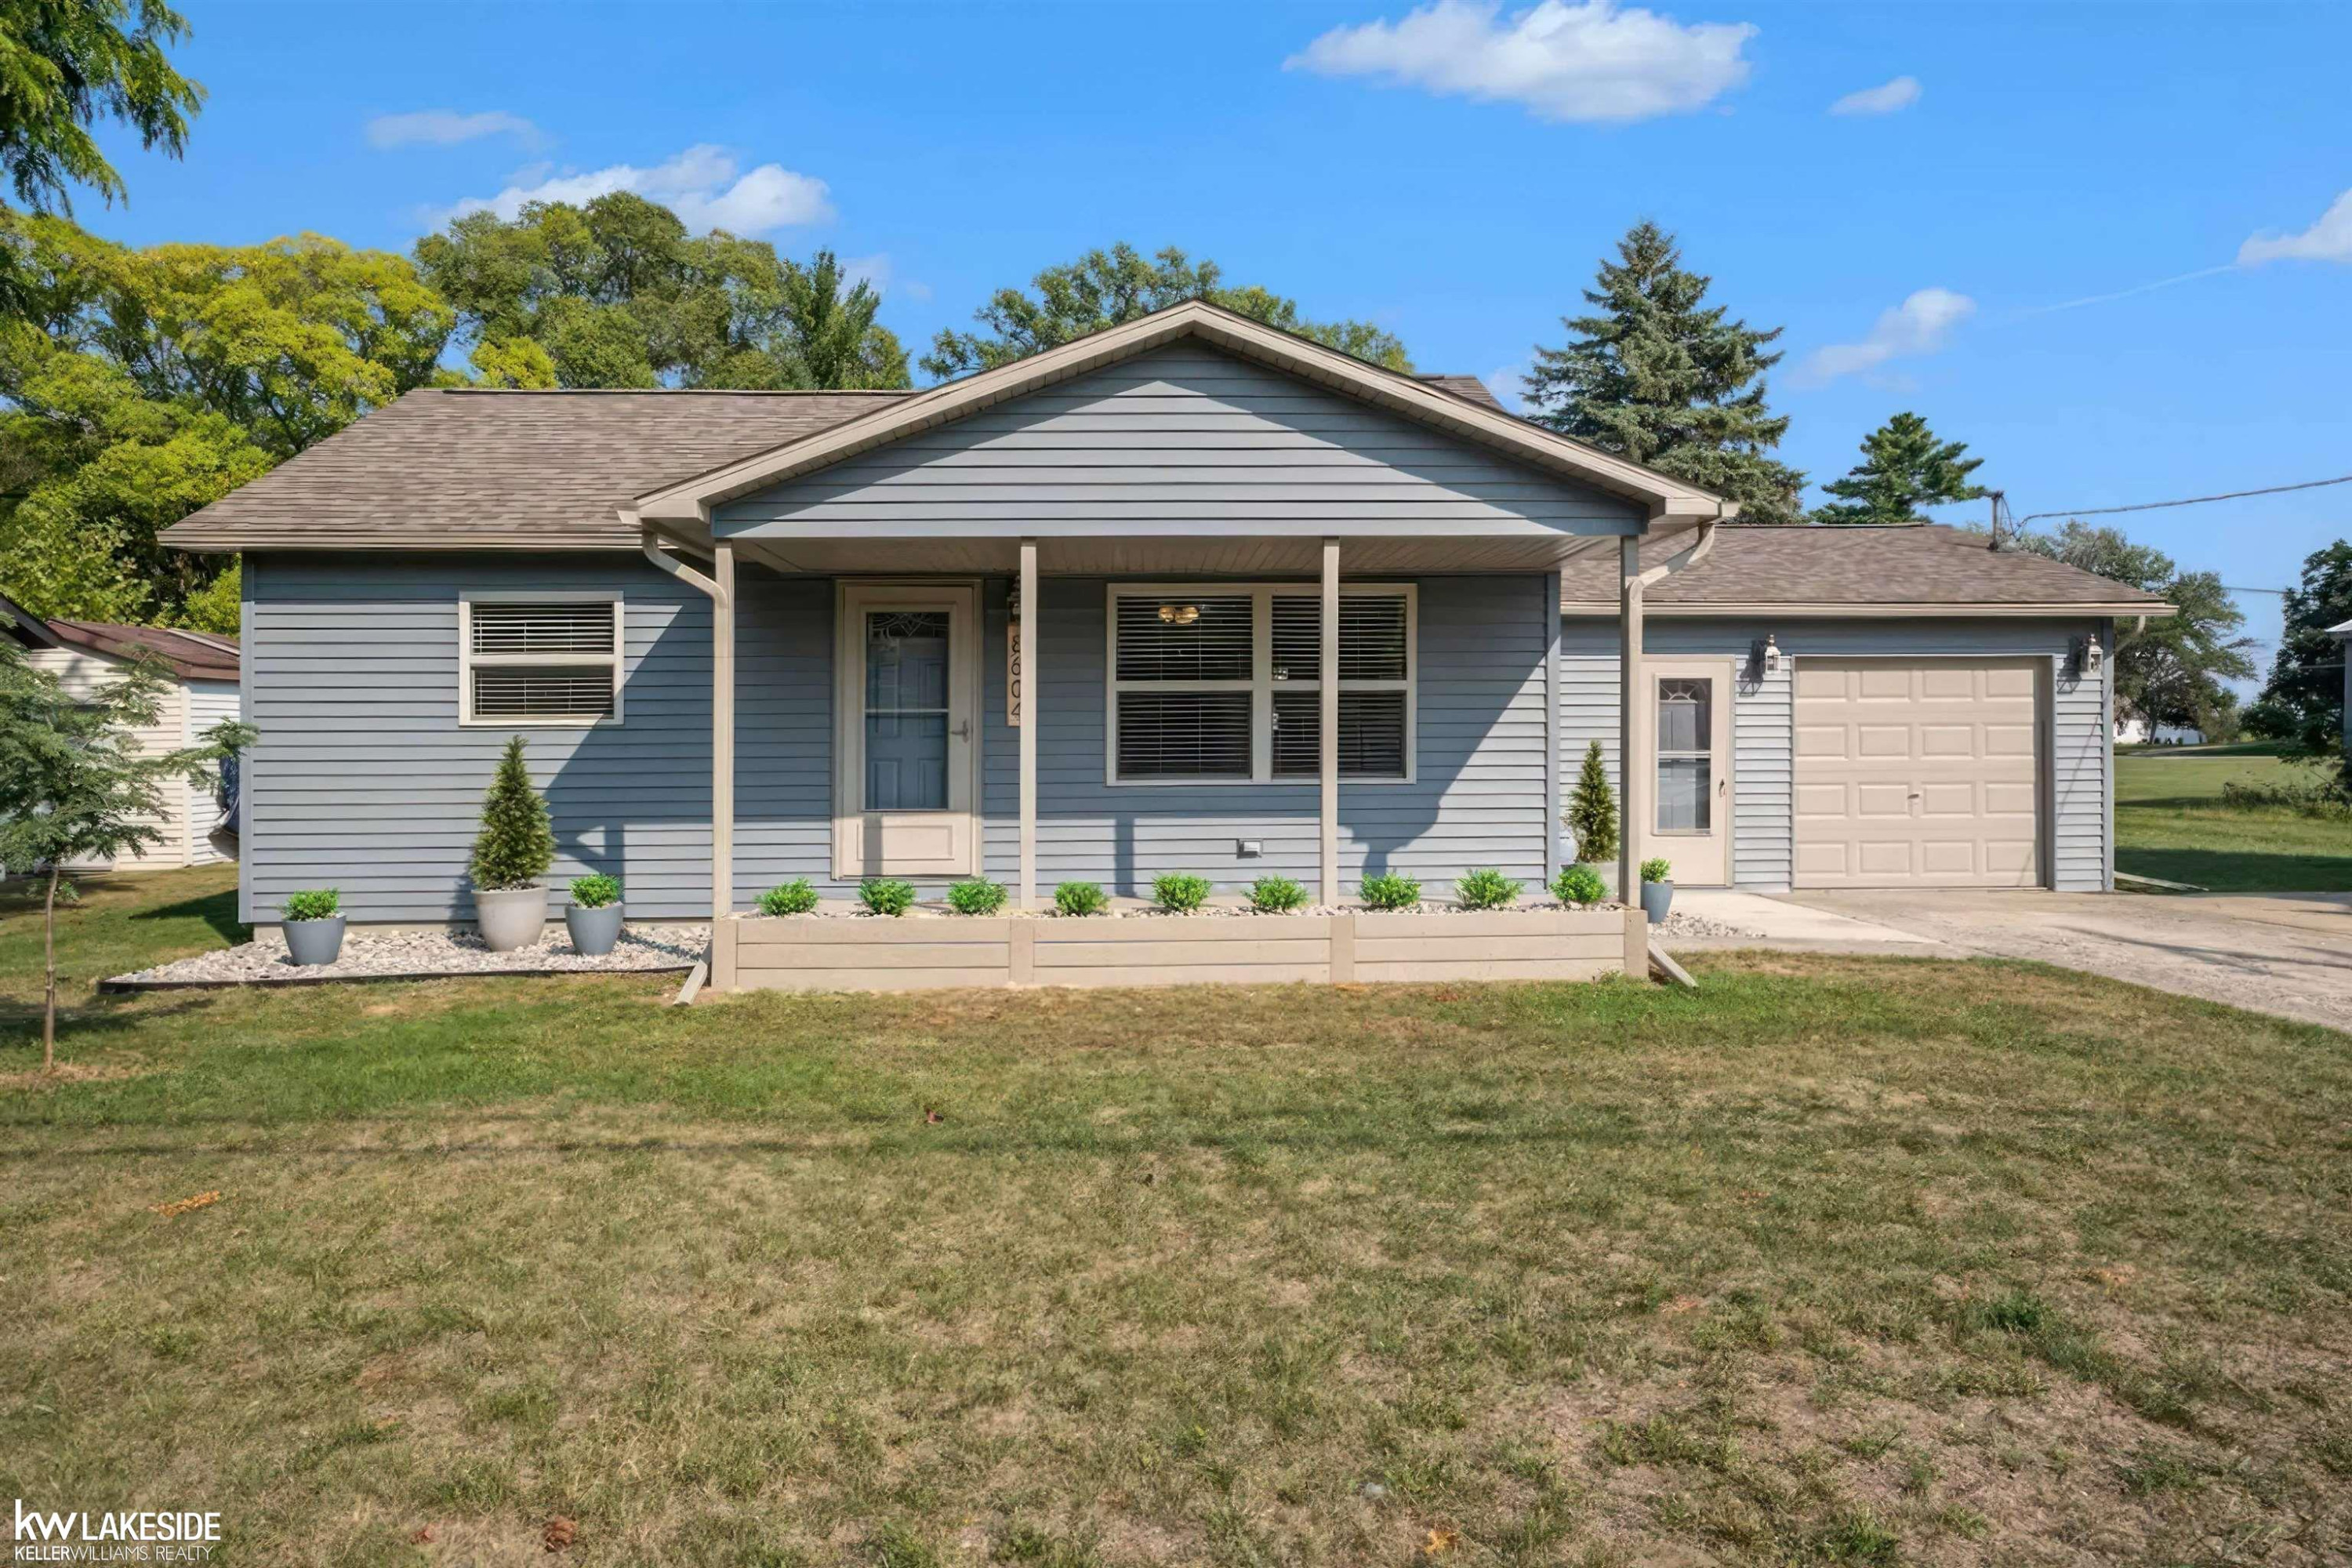
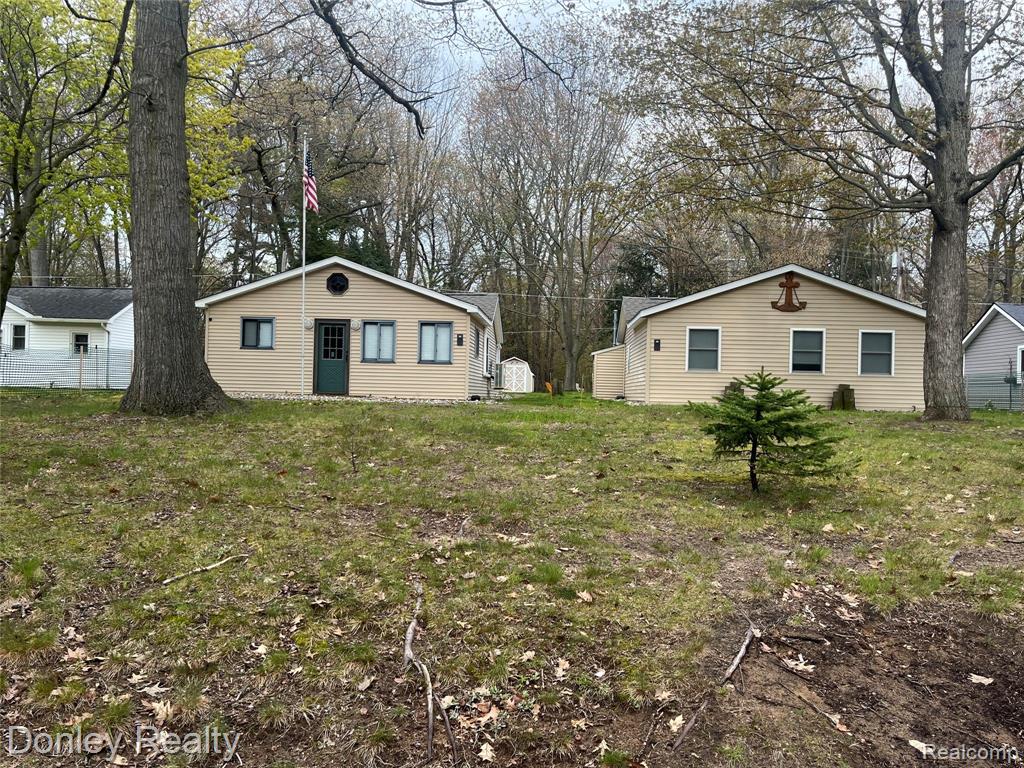
For Sale
1/29
$273,900
8604 Larned Road, Port Austin, MI 48467
2 bd1 ba0.25 ac
Single Family
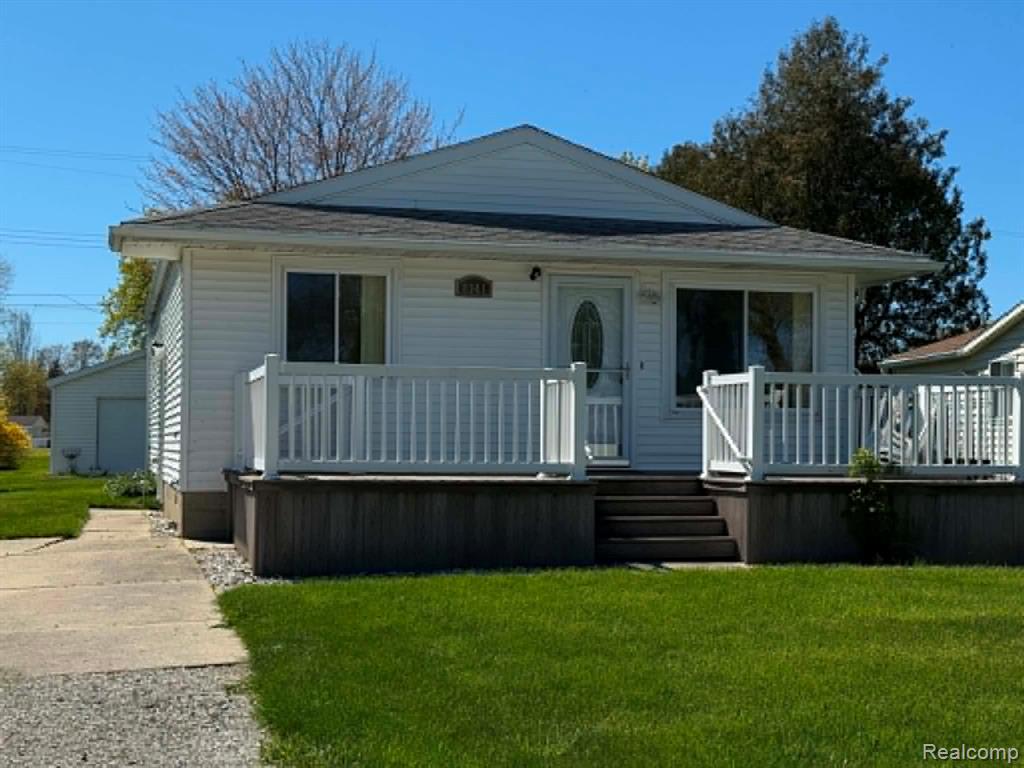
For Sale
1/13
$199,000
8541 Adams Street, Port Austin, MI 48467
3 bd1 ba1,056 sqft0.15 ac
Single Family

For Sale
1/26
$194,900
4656 Stoddard Road, Port Austin, MI 48467
3 bd3 ba2,100 sqft0.60 ac
Single Family
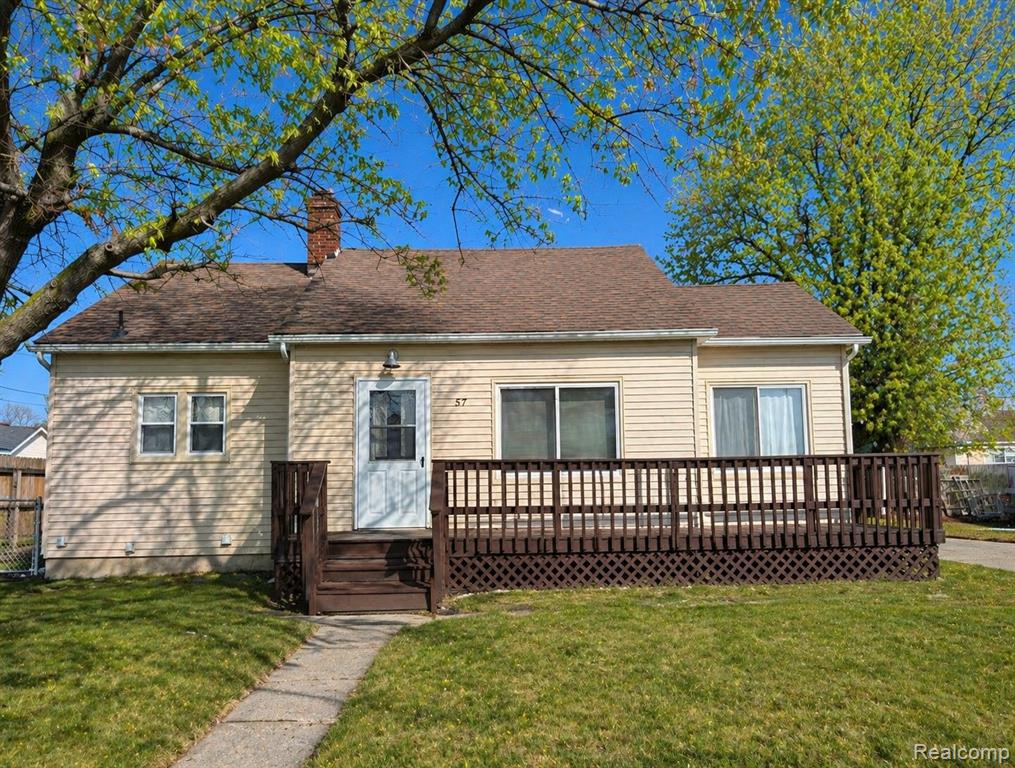
For Sale
1/54
$189,900
57 Grindstone Road, Port Austin, MI 48467
3 bd1 ba1,273 sqft0.22 ac
Single Family
Recently Sold(9)
| Address | Sold Price | Date Sold |
|---|---|---|
| 165 Washington Street, Port Austin, MI 48467 | $225,000 | Mar 9, 2026 |
| 331 Lakeview, 18, Port Austin, MI 48467 | $307,500 | Feb 11, 2026 |
| 8779 Larned Road, 21, Port Austin, MI 48467 | $369,900 | Oct 13, 2025 |
| 6639 Welch Road, Port Austin, MI 48467 | $90,000 | Sep 24, 2025 |
| 15 E Spring Court, 12, Port Austin, MI 48467 | $340,000 | Sep 17, 2025 |
| 30 Madison Street, Port Austin, MI 48467 | $159,900 | Aug 28, 2025 |
| 3136 Shore Drive, Port Austin, MI 48467 | $545,000 | Aug 14, 2025 |
| 275 MADISON Street, Port Austin, MI 48467 | $379,000 | Jul 20, 2025 |
| 8735 Blackberry Lane, Port Austin, MI 48467 | $265,000 | Jul 2, 2025 |
Frequently Asked Questions about Port Austin
What is the current real estate inventory in Port Austin?
There are currently 9 active listings in Port Austin. The median asking price is $300,000.
What are home prices like in Port Austin?
Based on 9 sales in the past year, homes in Port Austin have a median price of $300,000.
What is the average days on market in Port Austin?
Over the past year, homes in Port Austin spent an average of 78 days on market before selling.
Which school districts cover Port Austin?
Port Austin is served by one or more public school districts. In Michigan, school district boundaries do not always align with city limits, so different parts of Port Austin may be zoned for different districts. Check individual listings for the specific school district assignment.
How competitive is the Port Austin real estate market?
With 12.0 months of inventory, Port Austin is currently a buyer's market. This is based on 9 active listings and 9 sales in the past 12 months.
What are property taxes like in Port Austin?
Michigan property taxes in Port Austin are calculated using the State Equalized Value (SEV) times the local millage rate. Rates vary by school district and municipality. Primary residences qualify for a homestead exemption that reduces the tax rate.
What does demographic data show about housing demand in Port Austin?
Per U.S. Census ACS data, Port Austin has a +50.0% Household Formation Gap over the past 15 years. Average household size decreased from 1.67 to 1.84, creating demand for approximately 122 additional housing units even as population grew 65.3%. HFG is a secondary market indicator — it reflects demographic trends, not a primary measure like income-based affordability.