Coleman Real Estate
6 active listings · 27 sold in the past 12mo
$221,750
Median List Price
27
Sold (past 12mo)
106
Avg Days on Market
+5.8%
HFGⓘ
Household Formation Gap (HFG) is a secondary market indicator that measures hidden housing demand created by shrinking household sizes. As average household size decreases — due to divorce, single living, empty nesting, delayed marriage — more housing units are needed even without population growth. HFG compares the estimated number of households needed today versus 15 years ago: (population ÷ avg household size). This is a demographic trend signal, not a primary market indicator like income-based affordability or comparative market analysis. Source: U.S. Census Bureau, American Community Survey 5-Year Estimates (2009–2023), Tables B01003, B25010, B25001.
Active Listings
Loading map…
Market Dashboard
Homes for Sale(6)
View all with filters →
Under Contract
1/35
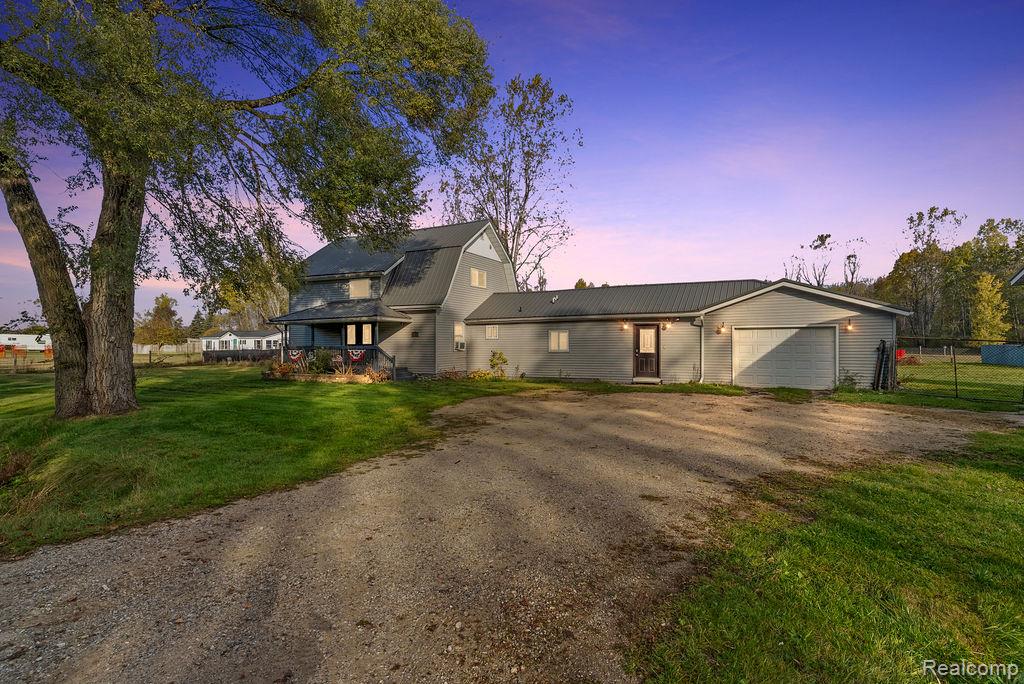
$350,000
4145 W Shearer Road, Coleman, MI 48618
3 bd2 ba40 ac
Single Family

Under Contract
1/38
$239,000
6455 N Geneva Road, Coleman, MI 48618
3 bd1 ba1 ac
Single Family
Under Contract
1/38
$228,500
2827 N Eleven Mile Road, Coleman, MI 48618
3 bd2 ba1.75 ac
Mfg Home
For Sale
1/40
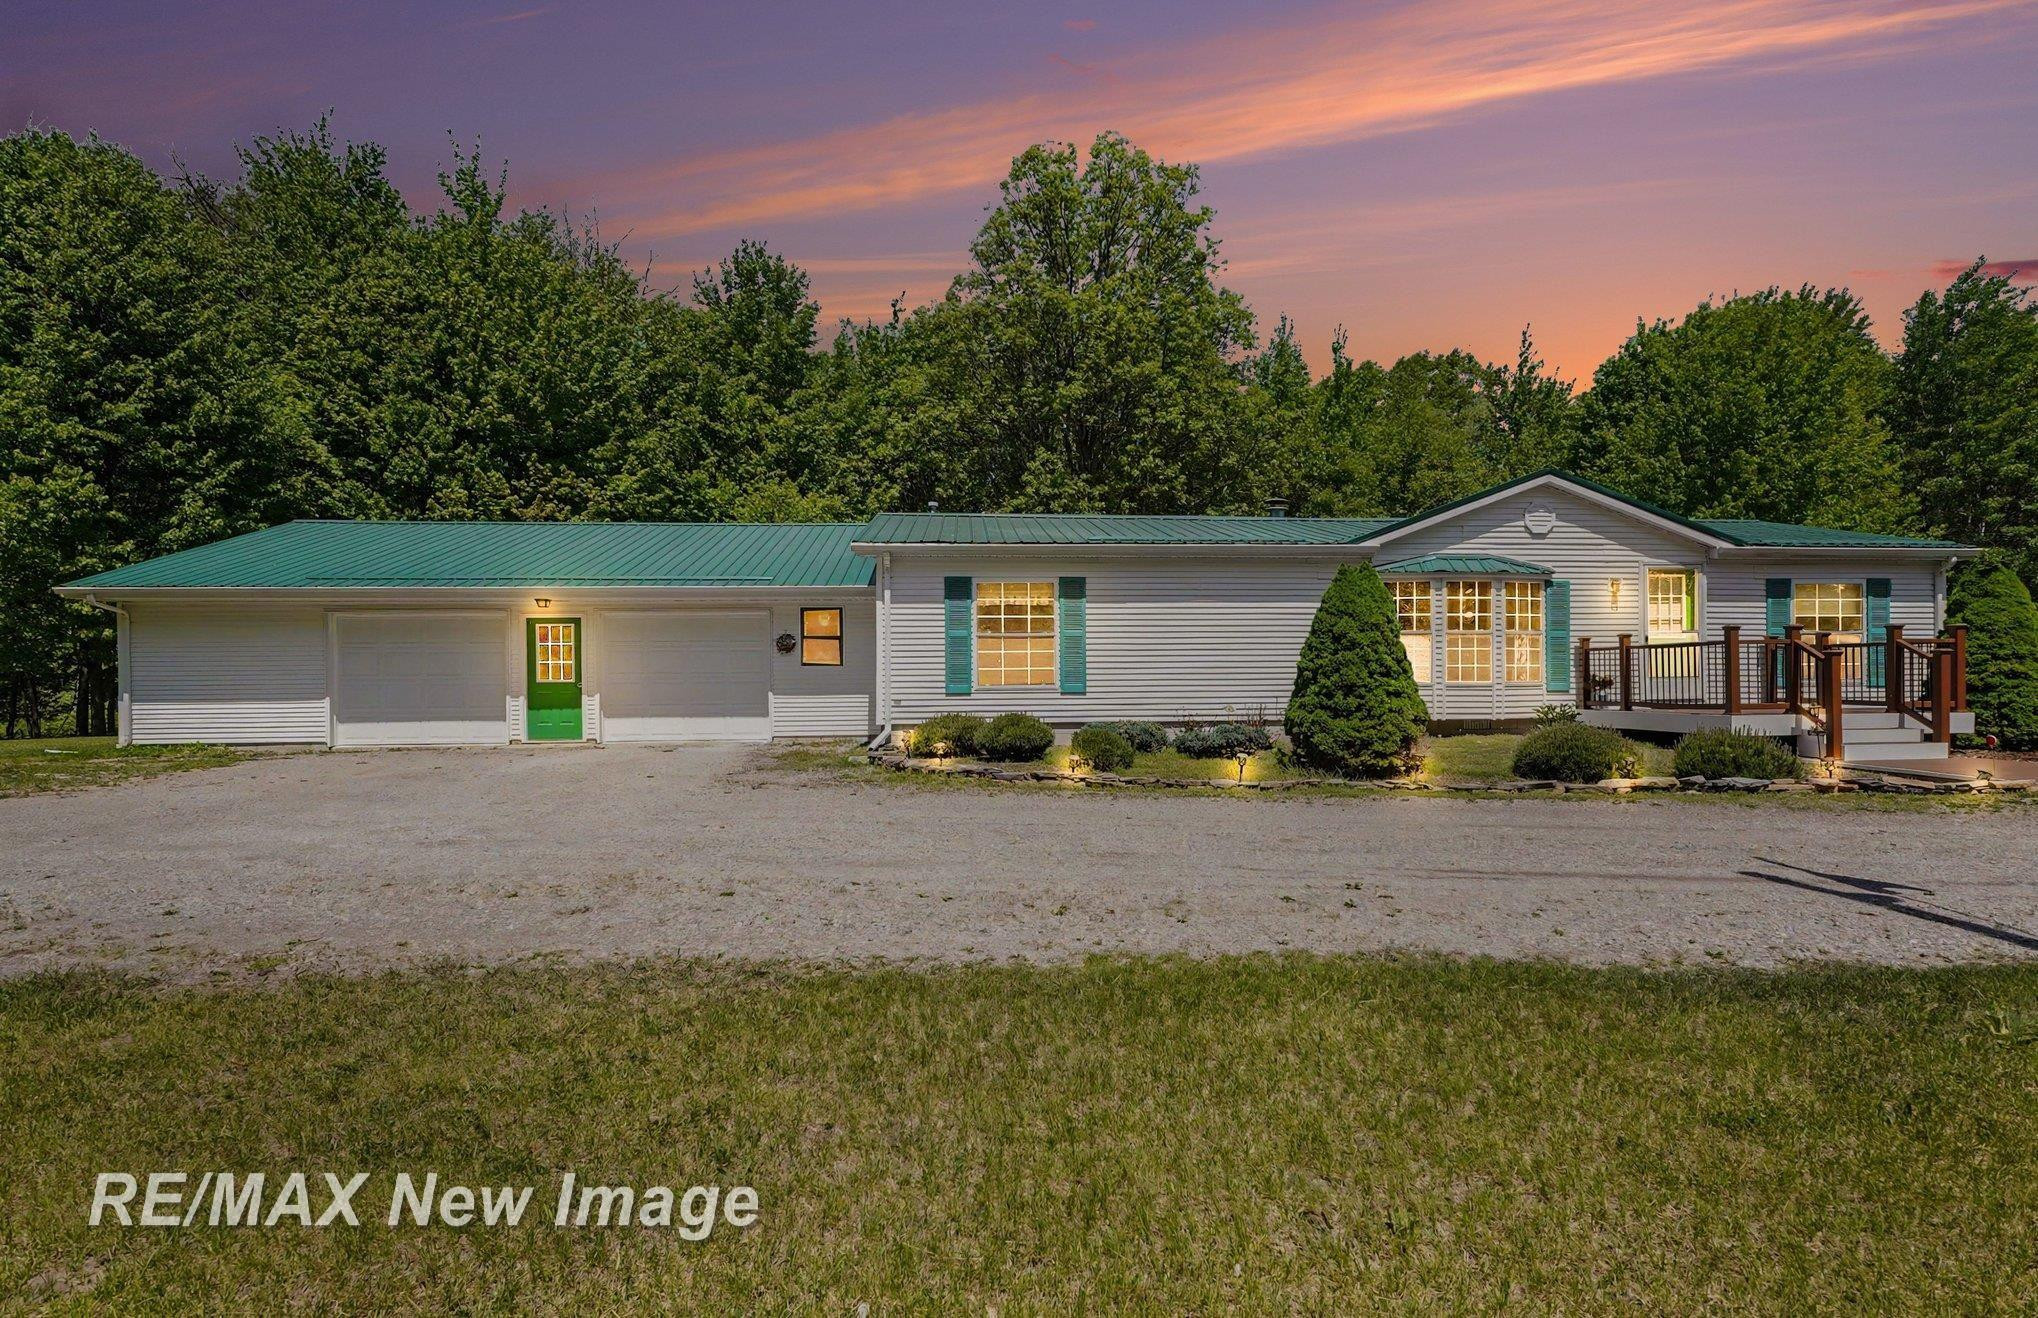
$215,000
4576 W Baker Road, Coleman, MI 48618
3 bd2 ba2,200 sqft1 ac
Single Family
Under Contract
1/43
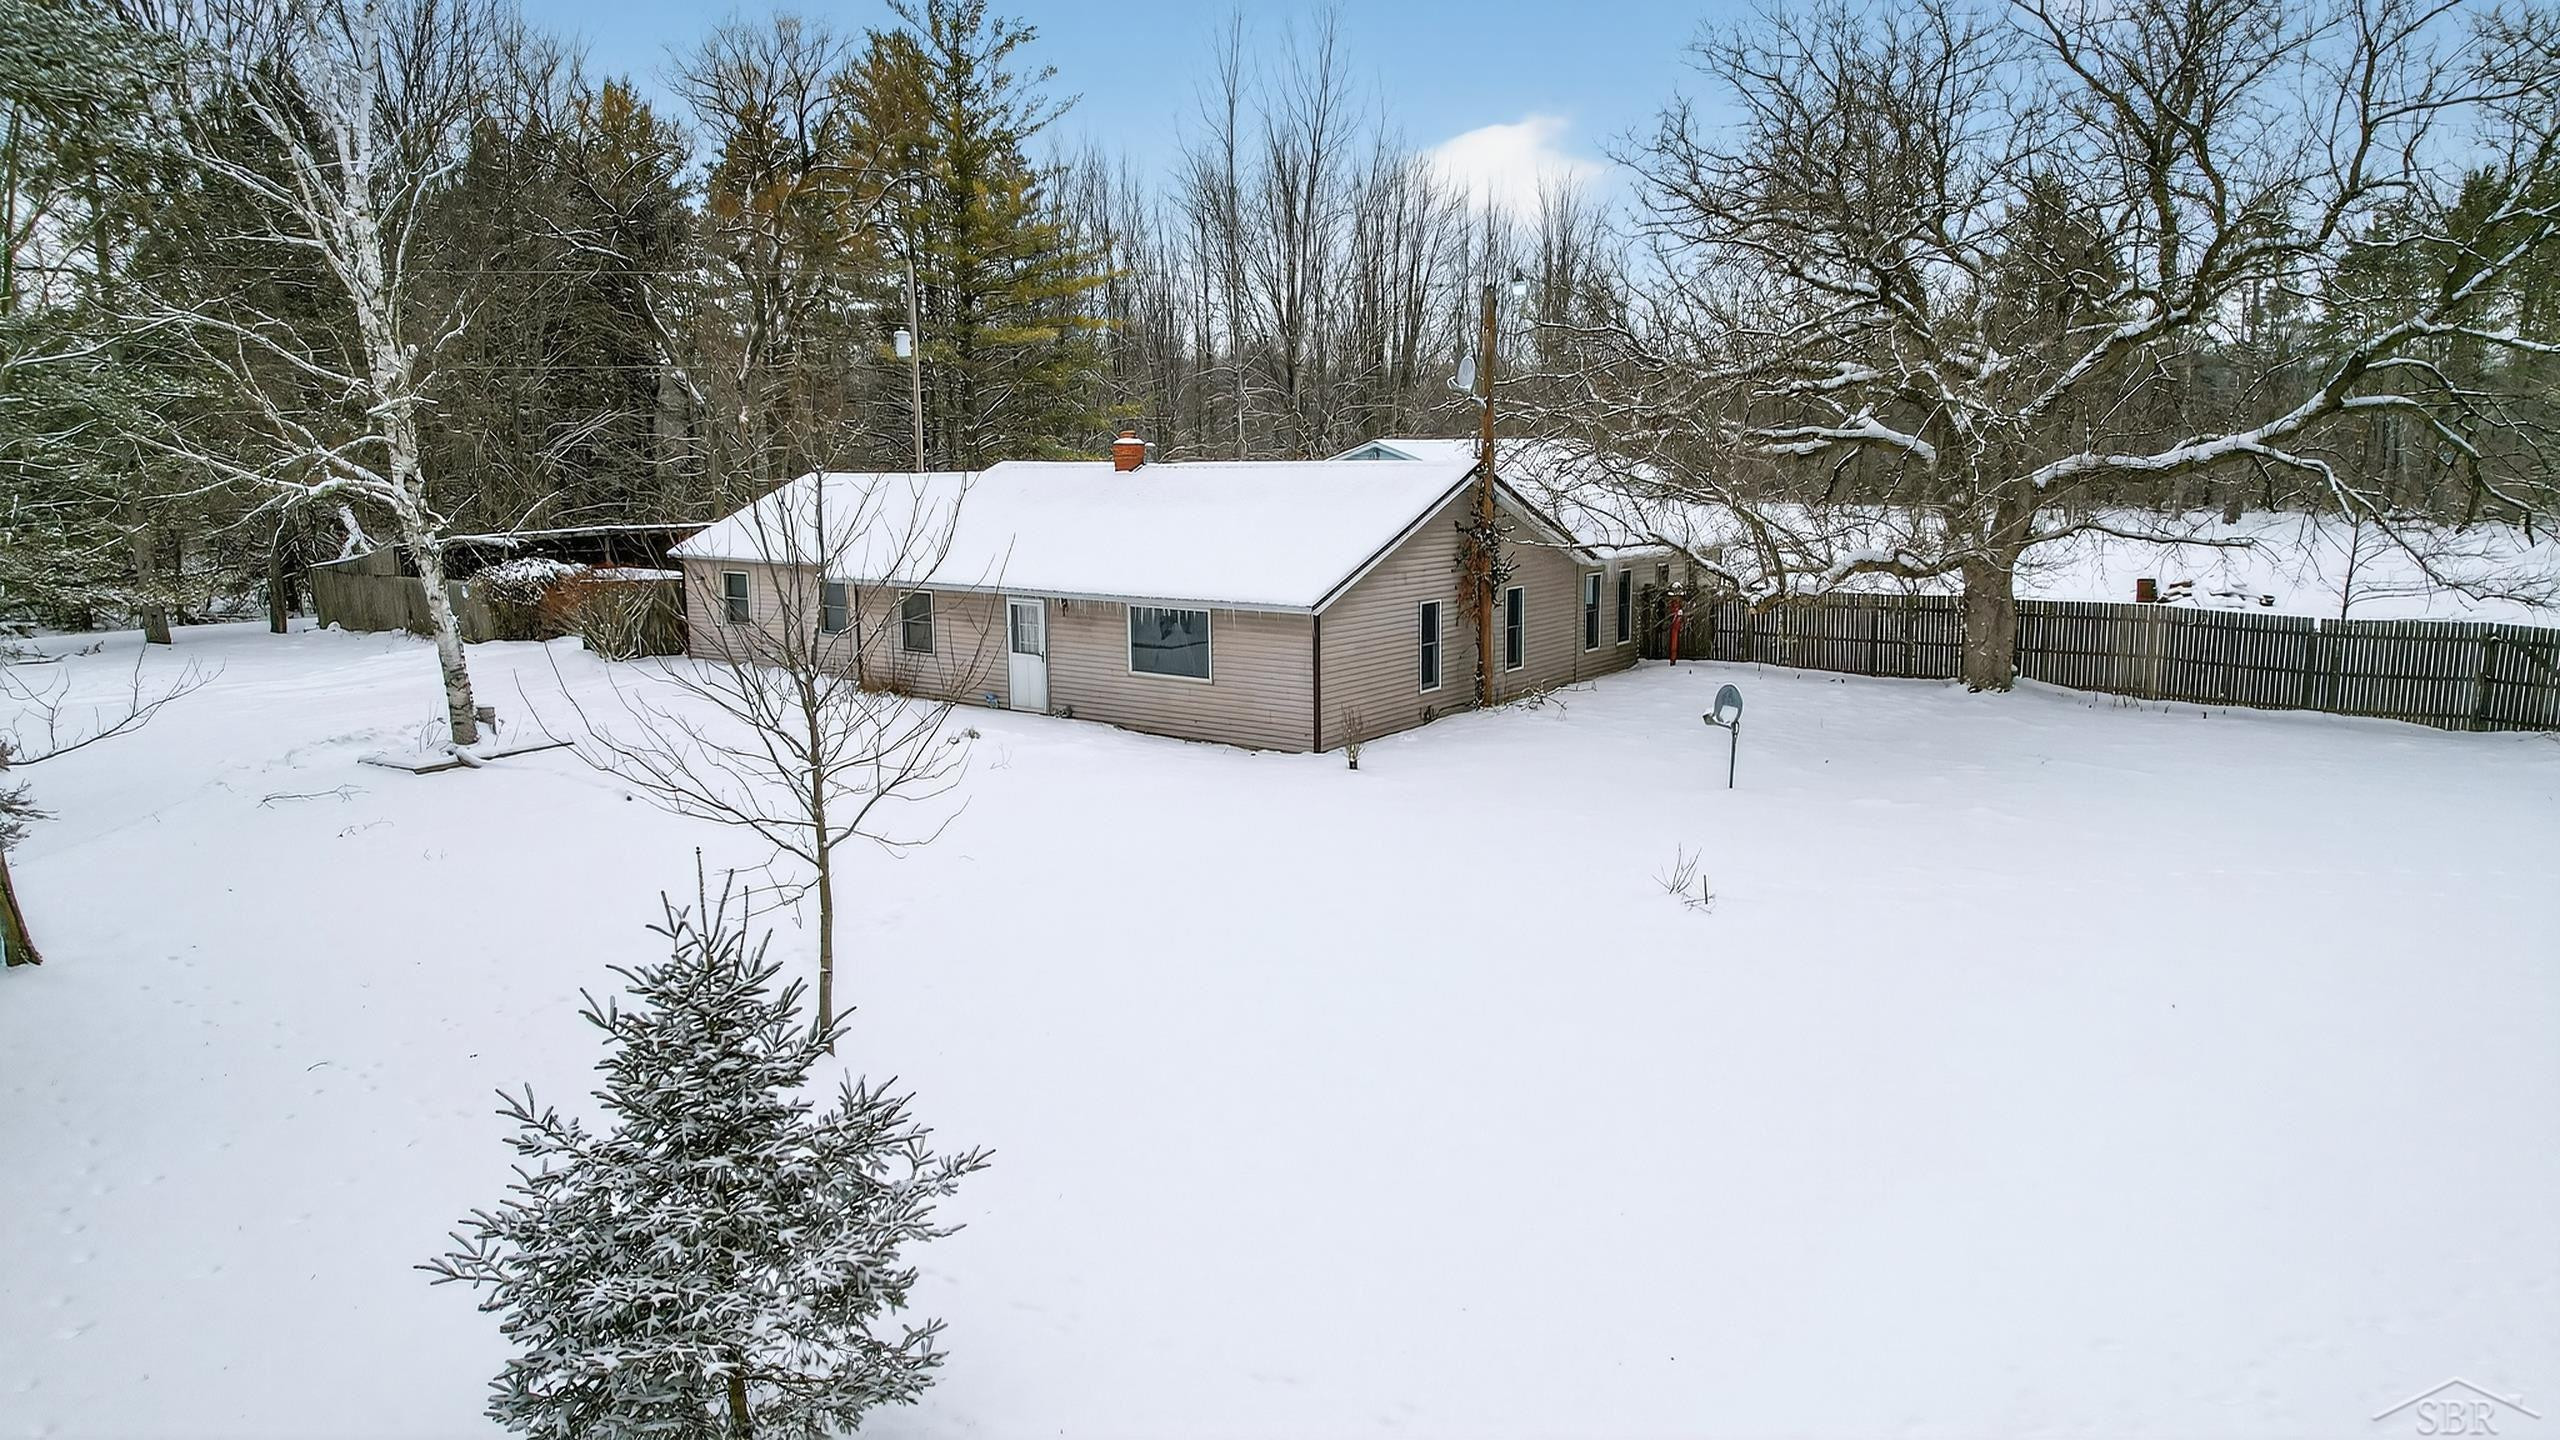
$175,000
3636 E Nielson Road, Coleman, MI 48618
2 bd1 ba2 ac
Single Family

Under Contract
1/26
$110,000
6542 N Geneva Road, Coleman, MI 48618
3 bd2 ba1 ac
Mfg Home
Recently Sold(27)
Frequently Asked Questions about Coleman
What is the current real estate inventory in Coleman?
Buyers in Coleman can choose from 6 active listings. The median asking price is $221,750.
What are home prices like in Coleman?
The median sale price in Coleman is $221,750, based on 27 closed sales over the past 12 months.
What is the average days on market in Coleman?
Homes in Coleman sell in an average of 106 days, based on 27 sales over the past 12 months.
Which school districts cover Coleman?
Multiple school districts may serve Coleman. Michigan school district boundaries are independent of city borders. The school district for a specific property depends on its exact location within the city.
How competitive is the Coleman real estate market?
Coleman is currently a seller's market, with 2.7 months of supply. That ratio comes from 6 active listings relative to 27 sales per year.
What are property taxes like in Coleman?
Property taxes in Coleman are based on a property's State Equalized Value (SEV), which is roughly 50% of market value, multiplied by the local millage rate. Homestead properties (primary residences) receive a lower rate than non-homestead. Tax bills are split into summer and winter installments.
What is the Household Formation Gap in Coleman?
Census demographic data shows a +5.8% Household Formation Gap in Coleman. As average household size fell from 2.2 to 1.99, the estimated number of households grew by 31. Population declined 4.3% over the same period. HFG is a secondary market indicator reflecting household formation trends, distinct from primary indicators like comparative market analysis.